Equinor ASA ADR (EQNR)

Currency in USD
27.52
+1.06(+4.01%)
Closed·
27.520.00(0.00%)
·
High dividend Yield
EQNR is not included in our AI-picked strategies. See which stocks are.
Fair Value
Day's Range
26.7527.76
52 wk Range
21.4128.27
Key Statistics
Prev. Close
26.46
Open
26.76
Day's Range
26.75-27.76
52 wk Range
21.41-28.27
Volume
6.52M
Average Volume (3m)
4.35M
1-Year Change
16.8577%
Book Value / Share
16.17
Fair Value
unlockUnlock
Fair Value Upside
unlockUnlock
EQNR Scorecardpro icon
Company’s Health
Unlock
Fair Value
Unlock Price
Fair Price
Upside
Price Target
24.22
Downside
-12.00%
Members' Sentiments
Bearish
Bullish
ProTips
Stock generally trades with low price volatility

Equinor ASA ADR News & Analysis

Show more

Technical Analysis

Summary
Strong Sell
Sell
Neutral
Buy
Strong Buy
Strong Buy
Technical Indicators
Strong Buy
Moving Averages
Buy

Equinor ASA ADR Company Profile

Equinor ASA, an energy company, engages in the exploration, production, transportation, refining, and marketing of petroleum and other forms of energy in Norway and internationally. It operates through Exploration & Production Norway; Exploration & Production International; Exploration & Production USA; Marketing, Midstream & Processing; Renewables; and Other segments. The company develops carbon capture and storage projects; provides transportation solutions, including pipelines, shipping, trucking, and rail; and develops and explores for renewable energy, such as offshore wind, green hydrogen, and solar power. The company was formerly known as Statoil ASA and changed its name to Equinor ASA in May 2018. Equinor ASA was incorporated in 1972 and is headquartered in Stavanger, Norway.

Industry
Oil & Gas
Sector
Energy
Employees
24384

Equinor ASA ADR SWOT Analysis


Energy Transition
Explore Equinor's strategic shift towards renewable energy, highlighted by its recent 10% stake acquisition in offshore wind developer Orsted
Financial Resilience
Delve into Equinor's robust financial health, with a "GREAT" overall score and impressive revenues of $104.8 billion in the last twelve months
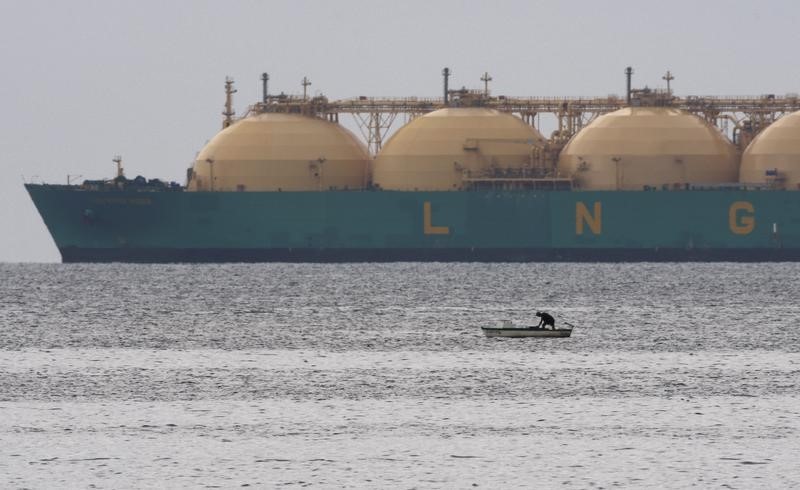
Market Challenges
Uncover the potential impact of subdued European gas prices on Equinor's revenue streams and the company's strategies to navigate this headwind
Investor Outlook
Learn about Equinor's evolving dividend policy, with special payments likely to cease in 2025, and its implications for investor appeal and stock valuation
Read full SWOT analysis

Equinor ASA ADR Earnings Call Summary for Q4/2025

  • Equinor's Q4 2025 EPS of $0.81 exceeded forecasts by 31.94%, with revenue reaching $25.3 billion, outperforming expectations by 12.49%
  • Record production of 2.137 million barrels per day, up 3.4% year-over-year, driven by new projects like Johan Castberg and Bacalhau
  • Despite strong earnings, stock dipped 0.49% pre-market to $26.21, reflecting broader market volatility and investor caution
  • Company announced a $1.5 billion share buyback program for 2026 and plans to increase quarterly cash dividend by 2 cents per share annually
  • Guidance includes 3% production increase for 2026, $4 billion reduction in capital expenditure over two years, and projected cash flow of $16B (2026) and $18B (2027)
Last Updated: 02/04/2026, 08:24 PM
Read Full Transcript

Compare EQNR to Peers and Sector

Metrics to compare
EQNR
Peers
Sector
Relationship
P/E Ratio
13.6x14.7x6.0x
PEG Ratio
−0.35−0.600.00
Price/Book
1.7x1.5x1.1x
Price / LTM Sales
0.6x1.5x1.3x
Upside (Analyst Target)
−10.2%−0.2%12.3%
Fair Value Upside
Unlock20.5%6.7%Unlock

Analyst Ratings

0 Buy
4 Hold
2 Sell
Ratings:
6 analysts
Overall Consensus
Neutral

Analysts 12-Month Price Target:

Average 24.22
(-12.00% Downside)
Firm
ArticlePositionPrice TargetUpside / DownsideFrom Price TargetActionDate
Danske
Sell---DowngradeJan 29, 2026
TD Cowen
Hold22.00-20.06%23.00MaintainSep 29, 2025
Morgan Stanley
Sell23.00-16.42%24.80DowngradeSep 03, 2025
TD Cowen
Hold23.00-16.42%21.00MaintainJul 24, 2025
Berenberg
Hold26.44-3.92%30.54DowngradeMay 20, 2025

Dividends

Payout Ratio
Payout ratio (TTM)
Earnings retained
EPS 1.94%
Dividend Yield
4.42%
Industry Median 4.90%
Annualized payout
1.22
Paid quarterly
5-Years Growth
+29.62%
Growth Streak

Earnings

Latest Release
Feb 04, 2026
EPS / Forecast
0.81 / 0.6139
Revenue / Forecast
25.30B / 22.49B
EPS Revisions
Last 90 days

EQNR Income Statement

People Also Watch

50.70
SLB
+2.40%
47.64
NVO
+9.92%
149.05
XOM
+2.03%
202.68
VLO
+4.40%

FAQ

What Is the Equinor ADR (EQNR) Stock Price Today?

The Equinor ADR stock price today is 27.52

What Stock Exchange Does Equinor ADR Trade On?

Equinor ADR is listed and trades on the New York Stock Exchange.

What Is the Stock Symbol for Equinor ADR?

The stock symbol for Equinor ADR is "EQNR."

Does Equinor ADR Pay Dividends? What’s The Current Dividend Yield?

The Equinor ADR dividend yield is 4.42%.

What Is the Equinor ADR Market Cap?

As of today, Equinor ADR market cap is 68.36B.

What Is Equinor ADR's Earnings Per Share (TTM)?

The Equinor ADR EPS (TTM) is 1.94.

When Is the Next Equinor ADR Earnings Date?

Equinor ADR will release its next earnings report on May 05, 2026.

From a Technical Analysis Perspective, Is EQNR a Buy or Sell?

Based on moving averages and other technical indicators, the daily buy/sell signal is Strong Buy.

How Many Times Has Equinor ADR Stock Split?

Equinor ADR has split 0 times.

How Many Employees Does Equinor ADR Have?

Equinor ADR has 24384 employees.

What is the current trading status of Equinor ADR (EQNR)?

As of Feb 06, 2026, Equinor ADR (EQNR) is trading at a price of 27.52, with a previous close of 26.46. The stock has fluctuated within a day range of 26.75 to 27.76, while its 52-week range spans from 21.41 to 28.27.

What Is Equinor ADR (EQNR) Price Target According to Analysts?

The average 12-month price target for Equinor ADR is USD24.22, with a high estimate of USD27.2 and a low estimate of USD21.4. 0 analysts recommend buying the stock, while 2 suggest selling, leading to an overall rating of Neutral. The stock has an -12.00% Downside potential.

What Is the EQNR Premarket Price?

EQNR's last pre-market stock price is 26.72. The pre-market share volume is 64,520.00, and the stock has decreased by 0.26, or 0.98%.
Risk Disclosure: Trading in financial instruments and/or cryptocurrencies involves high risks including the risk of losing some, or all, of your investment amount, and may not be suitable for all investors. Prices of cryptocurrencies are extremely volatile and may be affected by external factors such as financial, regulatory or political events. Trading on margin increases the financial risks.
Before deciding to trade in financial instrument or cryptocurrencies you should be fully informed of the risks and costs associated with trading the financial markets, carefully consider your investment objectives, level of experience, and risk appetite, and seek professional advice where needed.
Fusion Media would like to remind you that the data contained in this website is not necessarily real-time nor accurate. The data and prices on the website are not necessarily provided by any market or exchange, but may be provided by market makers, and so prices may not be accurate and may differ from the actual price at any given market, meaning prices are indicative and not appropriate for trading purposes. Fusion Media and any provider of the data contained in this website will not accept liability for any loss or damage as a result of your trading, or your reliance on the information contained within this website.
It is prohibited to use, store, reproduce, display, modify, transmit or distribute the data contained in this website without the explicit prior written permission of Fusion Media and/or the data provider. All intellectual property rights are reserved by the providers and/or the exchange providing the data contained in this website.
Fusion Media may be compensated by the advertisers that appear on the website, based on your interaction with the advertisements or advertisers.
© 2007-2026 - Fusion Media Limited. All Rights Reserved.