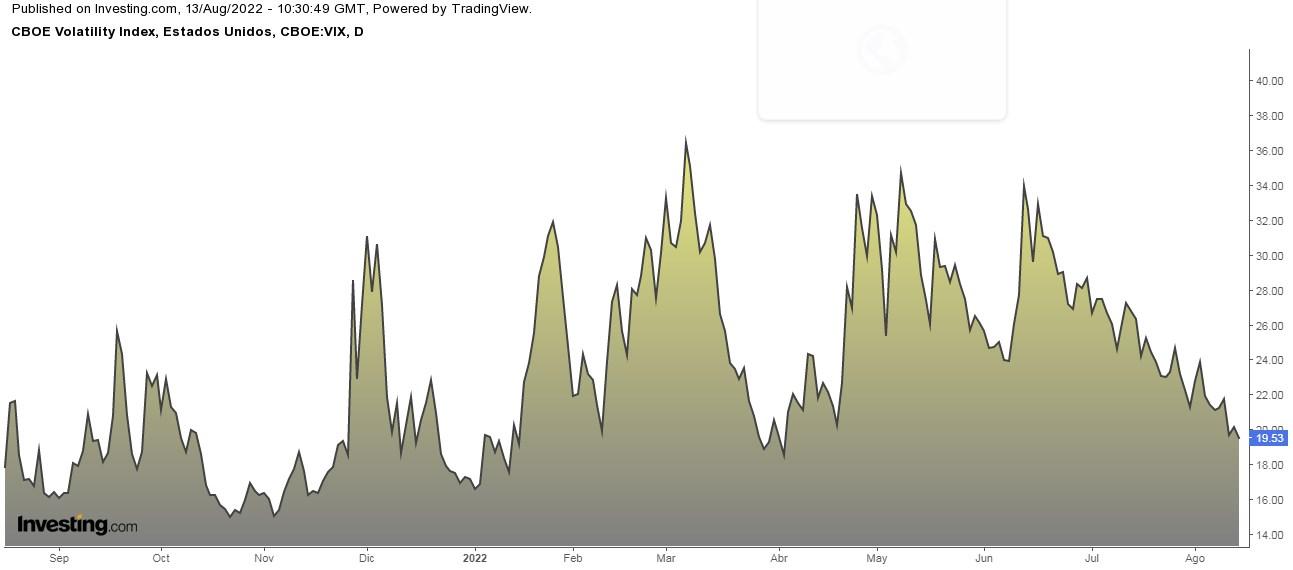
- The VIX (volatility index) has declined for eight consecutive weeks, the longest streak in the last three years
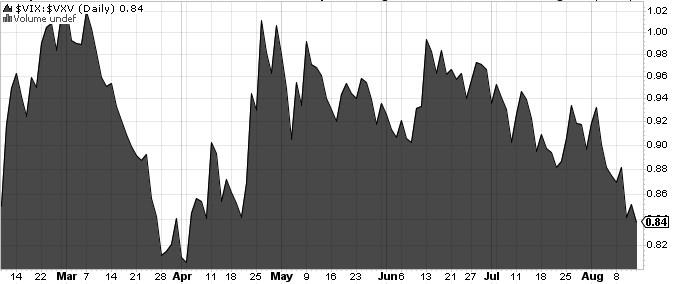
- The VIX/VXV measures the ratio between 1-month implied volatility and 3-month implied volatility
- A VIX/VXV ratio below 1 is historically a buy signal for the S&P 500
During the last six U.S. recessions, the S&P 500 gained an average of +61% between its recessionary low and when the NBER declared that the economic contraction had officially ended.
As a matter of fact, throughout the last 150 years, there have been 30 recessions in the U.S., and the S&P 500 managed to average a +6.9% annualized gain over that period (after adjusting for inflation).
In the short term, markets are also rebounding as last week's better-than-expected CPI data encouraged investors to believe that the Fed may take its foot off the gas at its September meeting, raising interest rates by less than 75bps.
The S&P 500 added its fourth consecutive week of gains, the longest since last November. On Friday, it also reached a significant milestone: it recovered half of the losses from its sharp decline earlier this year.
The uptrend has a lot to do with the fact that the percentage of S&P 500 stocks trading above their 50-day moving average is 88% (in mid-June, it was 2%), a proportion not seen since the spring of 2021.
For its part, the Nasdaq 100 managed to rise more than 20% from the June lows, which, according to technical orthodoxy, implies an exit from a bear market. From the high to the low, the tech-heavy index fell by 32.49% in 209 calendar days from November 19, 2021, to June 16, 2022. Over the past 50 years, the average bear market has seen an index fall -by 35.5% in 201 calendar days.
Watch What The VIX/VXV Ratio Indicates
The CBOE Volatility Index (VIX) has declined for eight consecutive weeks, the longest streak in the last three years.
But what is even more interesting is the VIX/VXV ratio. The VIX is the 1-month implied volatility, while the VXV is the 3-month implied volatility. VIX is usually lower than VXV because the longer the time horizon, the greater the uncertainty, basically because there is more risk that things can happen in 3 months than in 1 month.

And what is the VIX/VXV ratio now? 0.84.
How do you interpret the VIX/VXV ratio? Well, if we divide VIX by VXV, we get a number:
- If it is greater than one, it implies uncertainty, negative for equities.
- If it is less than one, it implies tranquility, favorable for equities.
- If it is close to 1.30, the market could be close to a top and will likely fall.
- If it is close to 0.95, the market could be close to making a floor and start to rise.
- If it is around 0.82, the S&P 500, the vast majority of the time in history, has been bullish and strong.
Is Money Returning To U.S. Stock Market?
In the week of August 3-10, money poured into U.S. equity mutual funds as investors bet that the Federal Reserve would slow the pace of interest rate hikes. During that period, $4.21 billion reached such funds—the largest weekly inflow since June 22.
Large-cap company funds saw inflows of $7.6 billion, the highest since May 25. In contrast, technology stock funds suffered outflows, specifically $852 million.
Investor sentiment (AAII)
Bullish sentiment (expectations that stocks will rise over the next six months) increased by 1.6 percentage points to 32.2%. Despite this, it remains below its historical average of 38%.
Bearish sentiment (the expectation that stocks will fall in the next six months) decreased 2.2 percentage points to 36.7% and remained above its historical average of 30.5%.
The stock market ranking so far in 2022 goes as follows (as of August 16):
- Brazilian Bovespa +7%
- British FTSE 100 +2.22%.
- Japanese Nikkei 225 +0.27%.
- Spanish IBEX 35 -2.25%
- Dow Jones Industrial Average -6.6%.
- French CAC 40 -7.9%
- S&P 500 -9.8%
- Euro Stoxx 50 -11.8%
- German DAX -12.6%.
- Chinese CSI 300 -15.4%
- Italian FTSE MIB -15.5%
- NASDAQ Composite -16%.
Disclosure: The author currently does not own any of the securities mentioned in this article.
