
CF Market Dominance | Vertex's stronghold in cystic fibrosis treatments underpins its financial health, with $11.4 billion in revenue and 10.5% growth, fueling expansion into new therapeutic areas |
Pipeline Potential | Delve into Vertex's diversification strategy, including promising developments in acute pain management, renal diseases, and type 1 diabetes treatments |
Market Valuation | Analysts set an average price target of $491, reflecting optimism about Vertex's growth prospects despite recent earnings falling short of expectations |
Strategic Challenges | Explore Vertex's approach to overcoming competition in pain management and navigating the risks associated with expanding beyond its core cystic fibrosis business |
Metrics to compare | VRTX | Sector Sector - Average of metrics from a broad group of related Healthcare sector companies | Relationship RelationshipVRTXPeersSector | |
|---|---|---|---|---|
P/E Ratio | 28.2x | 22.2x | −0.4x | |
PEG Ratio | 0.05 | −0.55 | 0.00 | |
Price/Book | 6.3x | 3.7x | 2.6x | |
Price / LTM Sales | 10.0x | 2.6x | 3.0x | |
Upside (Analyst Target) | 18.3% | 0.0% | 54.8% | |
Fair Value Upside | Unlock | 13.7% | 9.0% | Unlock |
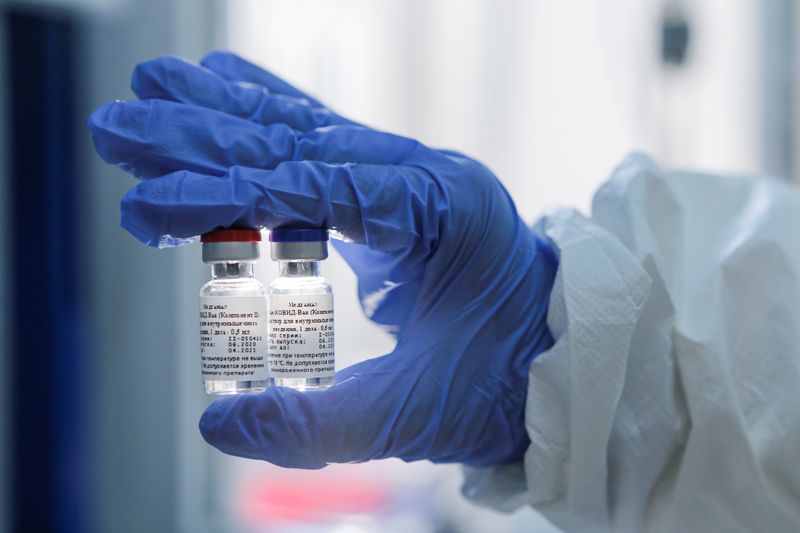
Vertex Pharmaceuticals Incorporated operates as a biotechnology company in the United States, Europe, and internationally. The company offers transformative medicines for people with serious diseases with a focus on specialty markets, such as cystic fibrosis (CF), sickle cell disease (SCD), transfusion dependent beta thalassemia (TDT), and acute pain. It markets TRIKAFTA/KAFTRIO for people with CF with at least one F508del mutation for 2 years of age and older; ALYFTREK for the treatment for people with CF 6 years of age and older; SYMDEKO/SYMKEVI for treatment of patients with CF 6 years of age and older; ORKAMBI for CF patients 1 year or older; and KALYDECO for the treatment of patients with 1 month or older who have CF with ivacaftor. The company also develops CASGEVY for the treatment of SCD and TDT; JOURNAVX for the treatment of acute pain in adults; VX-522, a CFTR mRNA therapeutic designed to treat the underlying cause of CF, which is in Phase 1/2 clinical trial; inaxaplin for the treatment of APOL1-mediated kidney disease, which is in single Phase 2 trial; VX-264 for treating Type 1 Diabetes; VX-670 for the treatment of myotonic dystrophy type 1; and VX-407, a small molecule corrector for the treatment of autosomal dominant polycystic kidney disease. The company sells its products primarily to specialty pharmacy and distributors, wholesalers, retail pharmacies, hospitals, and clinics. Vertex Pharmaceuticals Incorporated was founded in 1989 and is headquartered in Boston, Massachusetts.