Burberry Group PLC (BRBY)

London
Currency in GBP
948.2
-51.8(-5.18%)
Closed
BRBY Scorecard
Full Analysis
Management has been aggressively buying back shares
High dividend Yield
Fair Value
Day's Range
936.41,002.5
52 wk Range
8.11,285.5
Key Statistics
Edit
Bid/Ask
750.00 / 1,124.00
Prev. Close
1,000
Open
997.8
Day's Range
936.4-1,002.5
52 wk Range
8.1-1,285.5
Volume
1.92M
Average Volume (3m)
1.6M
1-Year Change
-24.75%
Fair Value
unlockUnlock
Fair Value Upside
unlockUnlock
BRBY Scorecardpro icon
Company’s Health
pro lockUnlock
Fair Value
pro lockUnlock Price
Fair Pricepro lock
Upsidepro lock
Price Target
1,101.6
Upside
+16.18%
Members' Sentiments
Bearish
Bullish
ProTips
Impressive gross profit margins
Show more

Burberry Group PLC Company Profile

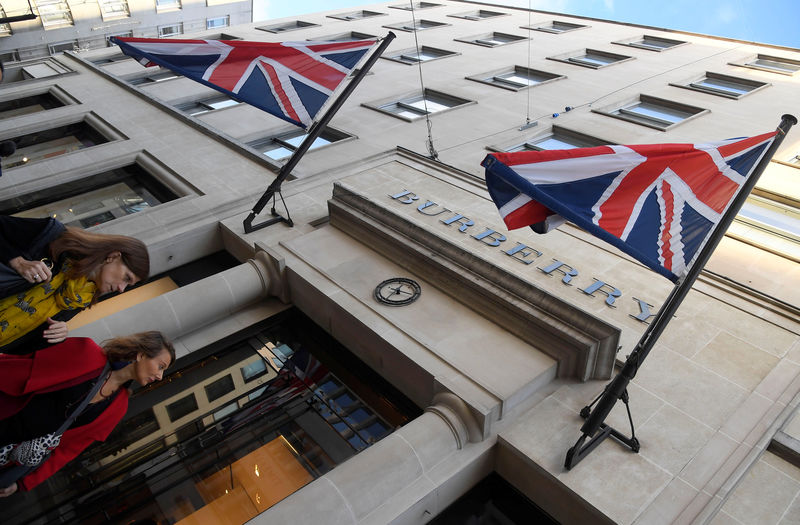
Burberry Group plc, together with its subsidiaries, manufactures, retails, and wholesales luxury goods under the Burberry brand. The company operates in two segments, Retail/Wholesale and Licensing. It provides womenswear, menswear, childrenswear, eyewear, shoes, beauty, and accessories, as well as leather goods, such as bags. The company also licenses third parties to manufacture and distribute products using the Burberry trademarks. It sells its products through Burberry mainline stores, concessions, outlets, digital commerce, Burberry franchisees, department stores, and multi-brand specialty accounts, as well as through Burberry.com website. It operates in the Asia Pacific, Europe, the Middle East, India, Africa, and the Americas. The company was founded in 1856 and is headquartered in London, the United Kingdom.

Compare BRBY to Peers and Sector

Metrics to compare
BRBY
Peers
Sector
Relationship
P/E Ratio
89.2x20.9x10.4x
PEG Ratio
−0.980.170.02
Price/Book
3.7x3.2x1.4x
Price / LTM Sales
1.3x1.6x0.9x
Upside (Analyst Target)
21.3%33.4%28.8%
Fair Value Upside
Unlock13.6%10.7%Unlock

Analyst Ratings

6 Buy
8 Hold
5 Sell
Ratings:
19 analysts
Overall Consensus
Neutral

Analysts 12-Month Price Target:

Average 1,101.6
(+16.18% Upside)

Dividends

Payout Ratio
Payout ratio (TTM)
Earnings retained
EPS 0.106
Dividend Yield
6.43%
Industry Median 2.71%
Annualized payout
61.00
Paid unevenly
5-Years Growth
-0.05%
Growth Streak

Earnings

Latest Release
Nov 14, 2024
EPS / Forecast
-- / 39.08
Revenue / Forecast
-- / 1.391B
EPS Revisions
Last 90 days

People Also Watch

1,369.000
RHMG
+6.29%
223.55
PRTP
-10.71%
605.10
LVMH
+0.02%
1,657.00
BAES
+4.18%
61.44
MONC
+2.09%

FAQ

What Is the Burberry Group (BRBY) Stock Price Today?

The Burberry Group stock price today is 948.20

What Stock Exchange Does Burberry Group Trade On?

Burberry Group is listed and trades on the London stock exchange.

What Is the Stock Symbol for Burberry Group?

The stock symbol for Burberry Group is "BRBY."

Does Burberry Group Pay Dividends? What’s The Current Dividend Yield?

The Burberry Group dividend yield is 6.43%.

What Is the Burberry Group Market Cap?

As of today, Burberry Group market cap is 3.39B.

What is Burberry Group Earnings Per Share?

The Burberry Group EPS is 0.106.

What Is the Next Burberry Group Earnings Date?

Burberry Group will release its next earnings report on May 13, 2025.

From a Technical Analysis Perspective, Is BRBY a Buy or Sell?

Based on moving averages and other technical indicators, the daily buy/sell signal is Strong Sell.
Risk Disclosure: Trading in financial instruments and/or cryptocurrencies involves high risks including the risk of losing some, or all, of your investment amount, and may not be suitable for all investors. Prices of cryptocurrencies are extremely volatile and may be affected by external factors such as financial, regulatory or political events. Trading on margin increases the financial risks.
Before deciding to trade in financial instrument or cryptocurrencies you should be fully informed of the risks and costs associated with trading the financial markets, carefully consider your investment objectives, level of experience, and risk appetite, and seek professional advice where needed.
Fusion Media would like to remind you that the data contained in this website is not necessarily real-time nor accurate. The data and prices on the website are not necessarily provided by any market or exchange, but may be provided by market makers, and so prices may not be accurate and may differ from the actual price at any given market, meaning prices are indicative and not appropriate for trading purposes. Fusion Media and any provider of the data contained in this website will not accept liability for any loss or damage as a result of your trading, or your reliance on the information contained within this website.
It is prohibited to use, store, reproduce, display, modify, transmit or distribute the data contained in this website without the explicit prior written permission of Fusion Media and/or the data provider. All intellectual property rights are reserved by the providers and/or the exchange providing the data contained in this website.
Fusion Media may be compensated by the advertisers that appear on the website, based on your interaction with the advertisements or advertisers.
© 2007-2025 - Fusion Media Limited. All Rights Reserved.