👀 Ones to watch: The MOST undervalued stocks to buy right nowSee Undervalued Stocks

Opening Bell: Vanishing Hopes of Broad U.S.-China Trade Deal Hit U.S Futures

Published 10/10/2019, 07:23 PM
Updated 09/02/2020, 02:05 PM
EUR/USD
-
GBP/USD
-
USD/JPY
-
XAU/USD
-
US500
-
JP225
-
DX
-
GC
-
ESZ24
-
CL
-
1YMZ24
-
NQZ24
-
IXIC
-
GB10YT=RR
-
DE10YT=RR
-
US2YT=X
-
US10YT=X
-
JP10YT=XX
-
KS11
-
SSEC
-
STOXX
-
MSCIEF
-
USD/CNH
-
TIOc1
-

  • U.S. futures weaken on mixed U.S.-China trade talks signals
  • Dollar falls as trade caution prevails
  • Treasury yields and WTI develop bearish patterns

Key Events

Futures on the S&P 500, Dow and NASDAQ 100 dropped with European stocks this morning, as lingering tensions between the U.S. and China dented sentiment ahead of trade talks kicking off in Washington today.

While U.S. contracts initially jumped on reports that U.S. tariff hikes scheduled for Oct. 15 might be postponed and some U.S. companies might be granted a waiver to supply Chinese tech giant Huawei, they later gave up those gains on signs that the latest U.S. move to blacklist 28 Chinese firms and restrict visas to some Chinese officials may jeopardize chances of a broad deal between the two economic powers.

Meanwhile, Europe's STOXX 600 trimmed half of yesterday’s bounce off the 200 DMA.

In the earlier Asian session, most indices gained, with South Korea’s KOSPI (-0.88%) as the notable exception. Japan’s Nikkei 225 (+0.45%) recouped losses after bouncing off the weekly lows, above the 200 DMA.

Global Financial Affairs

Yesterday, U.S. equities rebounded on trade talks optimism. The NASDAQ Composite (+1.02%) outperformed, followed closely by the S&P 500 (+0.91%).
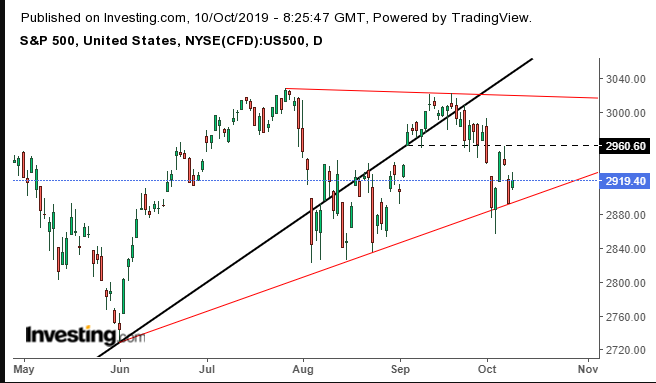
S&P 500 Daily Chart

The SPX rebounded after confirming the tenacity of bears in the the two previous sessions—after they forced a small H&S top last Tuesday, as we predicted. Tuesday’s low found support by an uptrend line (red) since June 3—if violated, it would mark the failure of an ascending triangle, presumed to be bearish. Meanwhile, the price is below the medium-term uptrend line since the December bottom, for the second time.
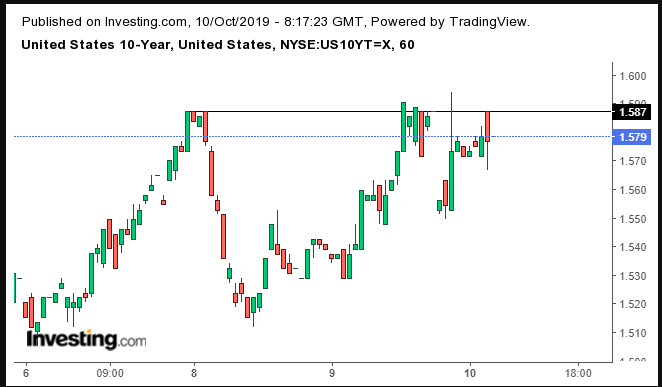
UST 10-Year Hourly Chart

Over to bond markets, yields on 10-year Treasurys struggled against resistance since the week’s highs.
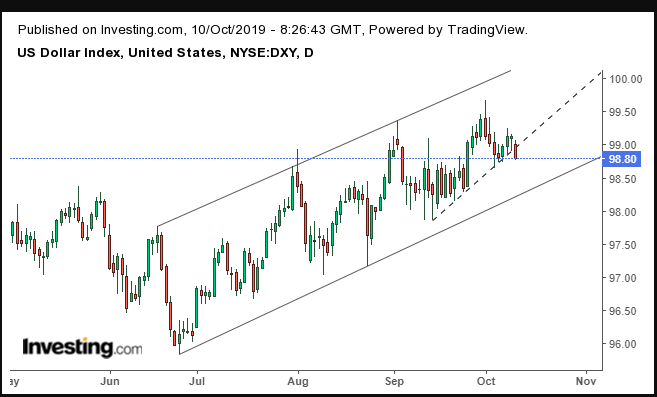
DXY Daily Chart

The dollar fell for the second day, below its uptrend line since Sept. 13, but well above the bottom of its rising channel since June.
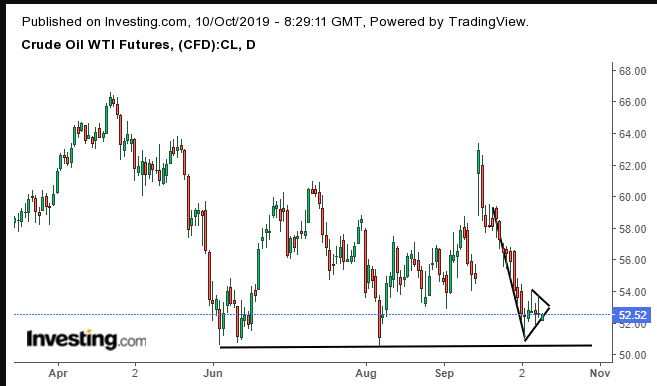
WTI Daily Chart

The conflicting reports about the U.S.-China trade also whipsawed oil prices. Technically, the WTI price is attempting a downside breakout to a pennant, bearish after the drop from $60 in just a week. A downside breakout would increase the odds of the price falling below the $50 support since June.

Up Ahead

  • Minutes from the European Central Bank’s most recent policy meeting are due on Thursday.
  • The U.S. releases a key measure of inflation on Thursday.
  • Chinese President Xi Jinping is scheduled to meet Indian Prime Minister Narendra Modi on Friday and Saturday for an informal summit.

Market Moves

Stocks

  • The Shanghai Composite climbed 0.8%.
  • The MSCI Emerging Market Index was little changed.
  • Currencies

  • The Dollar Index slid 0.2%.
  • The euro climbed 0.4% to $1.1018.
  • The British pound gained 0.2% to $1.2233.
  • The offshore yuan strengthened 0.2% to 7.1233 per dollar.
  • The Japanese yen appreciated 0.1% to 107.40 per dollar.
  • Bonds

  • The yield on 10-year Treasurys fell two basis points to 1.57%.
  • The yield on 2-yearTreasurys slipped two basis points to 1.44%.
  • Germany’s 10-year yield climbed less than one basis point to -0.54%.
  • Britain’s 10-year yield increased less than one basis point to 0.464%.
  • Japan’s 10-year yield dropped one basis point to -0.207%.
  • Commodities

  • West Texas Intermediate crude declined 0.5% to $52.35 a barrel.
  • Iron ore increased 2.7% to $88.50 per metric ton.
  • Gold climbed 0.3% to $1,509.56 an ounce.
  • Latest comments

    Loading next article…
    Risk Disclosure: Trading in financial instruments and/or cryptocurrencies involves high risks including the risk of losing some, or all, of your investment amount, and may not be suitable for all investors. Prices of cryptocurrencies are extremely volatile and may be affected by external factors such as financial, regulatory or political events. Trading on margin increases the financial risks.
    Before deciding to trade in financial instrument or cryptocurrencies you should be fully informed of the risks and costs associated with trading the financial markets, carefully consider your investment objectives, level of experience, and risk appetite, and seek professional advice where needed.
    Fusion Media would like to remind you that the data contained in this website is not necessarily real-time nor accurate. The data and prices on the website are not necessarily provided by any market or exchange, but may be provided by market makers, and so prices may not be accurate and may differ from the actual price at any given market, meaning prices are indicative and not appropriate for trading purposes. Fusion Media and any provider of the data contained in this website will not accept liability for any loss or damage as a result of your trading, or your reliance on the information contained within this website.
    It is prohibited to use, store, reproduce, display, modify, transmit or distribute the data contained in this website without the explicit prior written permission of Fusion Media and/or the data provider. All intellectual property rights are reserved by the providers and/or the exchange providing the data contained in this website.
    Fusion Media may be compensated by the advertisers that appear on the website, based on your interaction with the advertisements or advertisers.
    © 2007-2024 - Fusion Media Limited. All Rights Reserved.