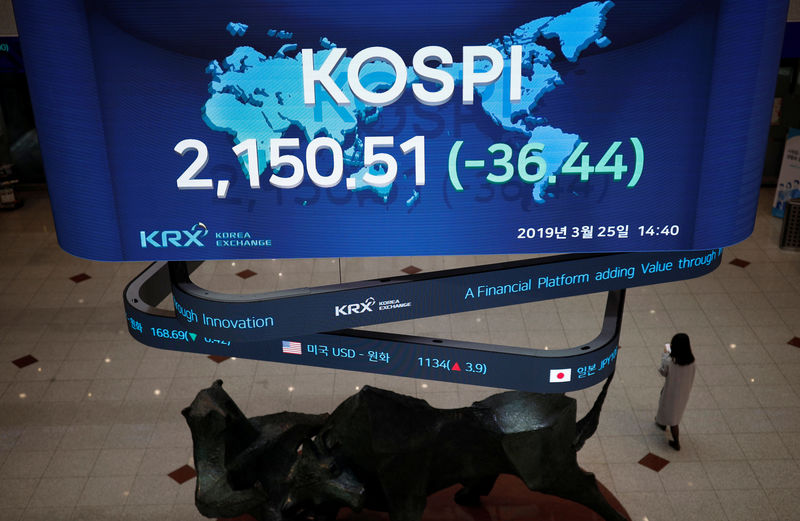
* South Korea stocks up nearly 7% this year
* Philippine Q4 GDP shrinks slightly less than expected
* Graphic: World FX rates https://tmsnrt.rs/2RBWI5E
* Asian stock markets: https://tmsnrt.rs/2zpUAr4
Jan 28 (Reuters) - South Korea, China and Singapore led
emerging Asian stock markets lower on Thursday after worries
about excessive valuations led to a selloff on Wall Street,
supporting gains in the safe-haven dollar at the expense of
regional currencies.
Stock markets in Jakarta .JKSE and Taipei .TWII joined
those in Seoul .KS11 , Singapore .STI and Shanghai .SSEC in
declining more than 1% after Wall Street suffered its biggest
one-day percentage drop in three months overnight. .N
Also on Wednesday, the U.S. Federal Reserve flagged a
worrying slowdown in the pace of recovery of the world's top
economy, pledging continued support until a full economic
rebound is in place. "Fear of the retail marauders seems to have spilled into
Asia this morning," Maybank analysts wrote in a note.
An influx of amateur traders and a flood of liquidity have
also boosted shares in Asia, stretching valuations. South Korea
is up nearly 7% this year, on top of the 30%-plus jump last
year.
Investors in the Philippines found less reason to join the
regional selling pressure given the local stock market .PSI is
the worst regional performer so far this year, down nearly 4%.
GDP data showed the Philippine economy shrank 8.3% in the
December quarter, slower than the 8.5% expected in a Reuters
poll. Stocks .PSI on Thursday edged 0.1% higher. However, for 2020, the economy recorded its biggest
contraction ever, falling 9.5%.
Worries around the pace of a global recovery have supported
the dollar, which in the lead up to 2021 had been falling.
The won KRW=KFTC fell nearly 1%, while the rupiah IDR= -
favoured by foreign investors looking to tap Indonesia's
high-yielding debt - dropped 0.3%.
Malaysian markets were closed for a public holiday.
HIGHLIGHTS:
** Indonesian 3-year benchmark yields are down 1.2 basis
points at 5.178%
** Top losers in Singapore include Jardine Cycle & Carriage
Ltd JCYC.SI and Sembcorp Industries Ltd SCIL.SI
** The big short: GameStop effect puts global bets worth
billions at risk
Asia stock indexes and currencies at 0400 GMT
COUNTRY FX FX FX INDEX STOCKS STOCKS
RIC DAILY % YTD % DAILY % YTD %
Japan JPY= -0.24 -1.05 .N225 -1.16 3.13
China CNY=CFXS +0.06 +0.77 .SSEC -1.48 1.36
India INR=IN +0.00 +0.20 .NSEI -0.80 -0.90
Indonesia IDR= -0.28 -0.25 .JKSE -0.94 1.21
Malaysia MYR= - -0.59 .KLSE - -2.86
Philippines PHP= -0.06 -0.23 .PSI 0.12 -3.75
S.Korea KRW=KFTC -0.94 -2.57 .KS11 -1.69 6.83
Singapore SGD= -0.21 -0.79 .STI -1.15 2.84
Taiwan TWD=TP +1.35 +1.72 .TWII -1.91 4.54
Thailand THB=TH -0.13 -0.17 .SETI -0.52 2.83
