Meta introduces SAM Audio model for sound isolation from mixed audio
- Friday's market turmoil reflects ongoing economic uncertainty, increasing US recession odds again.
- Meanwhile, Goldman Sachs challenges the yield curve's predictive power in today's economy.
- Who's right?
We're again going through a turbulent period in the world in which the economy and stock markets will also be more volatile in consequence. Friday was no exception.
On that day, we were met with a barrage of U.S. economic data, including private payrolls, nonfarm payrolls, and the unemployment rate. Initially, we witnessed a surge in yields and a sharp drop in stocks. However, just as the session was about to begin, stocks staged an unexpected turnaround, closing the day in positive territory. Notably, this marked the first time the S&P 500 had closed a session with a gain of over 1 percent since late August.
The current market climate has become increasingly challenging to decipher. It often forces us to confront a difficult truth: admitting when we were wrong and didn't anticipate such market movements.
Over the past year and a half, central banks worldwide have been combatting inflation by aggressively raising interest rates. The Federal Reserve's actions have been among the most assertive in history. Remarkably, despite these measures, we have not yet experienced a recession.
Given the significant amount of time that has elapsed, could we perhaps argue that we are already witnessing a gentle economic slowdown?
In the present moment, if we scrutinize one of the prominent trends—comparing the NASDAQ and Russell 3000 indices—it becomes evident that mega-cap growth stocks continue to outperform both small-caps and large-caps. This trend remains a noteworthy aspect of the current market landscape. Examining the chart, we can clearly observe the robust performance of growth stocks, which has propelled the NASDAQ to record-high levels. Consequently, one might surmise that large-cap companies will persist in their growth trajectory while smaller firms will keep on facing more of the ongoing challenges.
This leads us to ponder a pertinent question: If the prevailing consensus among economists and analysts is that the market is on the brink of a collapse, why do we witness Consumer Discretionary sectors, which deal in secondary goods, consistently exhibiting greater strength than Consumer Staples, which are associated with essential consumer products.
The relationship between Consumer Discretionary (NYSE:XLY) and Consumer Staples (NYSE:XLP) is generally key to understanding market cycles.During bull markets, it can validate index trends and, conversely, during bear markets to detect potential divergences that could serve as early indicators of reversals preceding shifts in the indexes themselves.
Since the outset of the year, discretionary stocks have exhibited a bullish trajectory relative to commodities. Presently, this aligns with the traditional behavior expected in "healthy" markets.
As the pessimism in the air thickens and the permabears take courage again we should ask ourselves: how is it that we have not yet seen any rotation into Consumer Staples, when historically it happens, if equities are under pressure?
We may have placed an excessive emphasis on the declines in the S&P 500, disregarding the statistical tendency for a seasonal correction during this time of year—a correction that may potentially persist. It's crucial to remember the impact of seasonality and the historically bearish phase for equities during this period. The element of surprise from many quarters is somewhat puzzling.
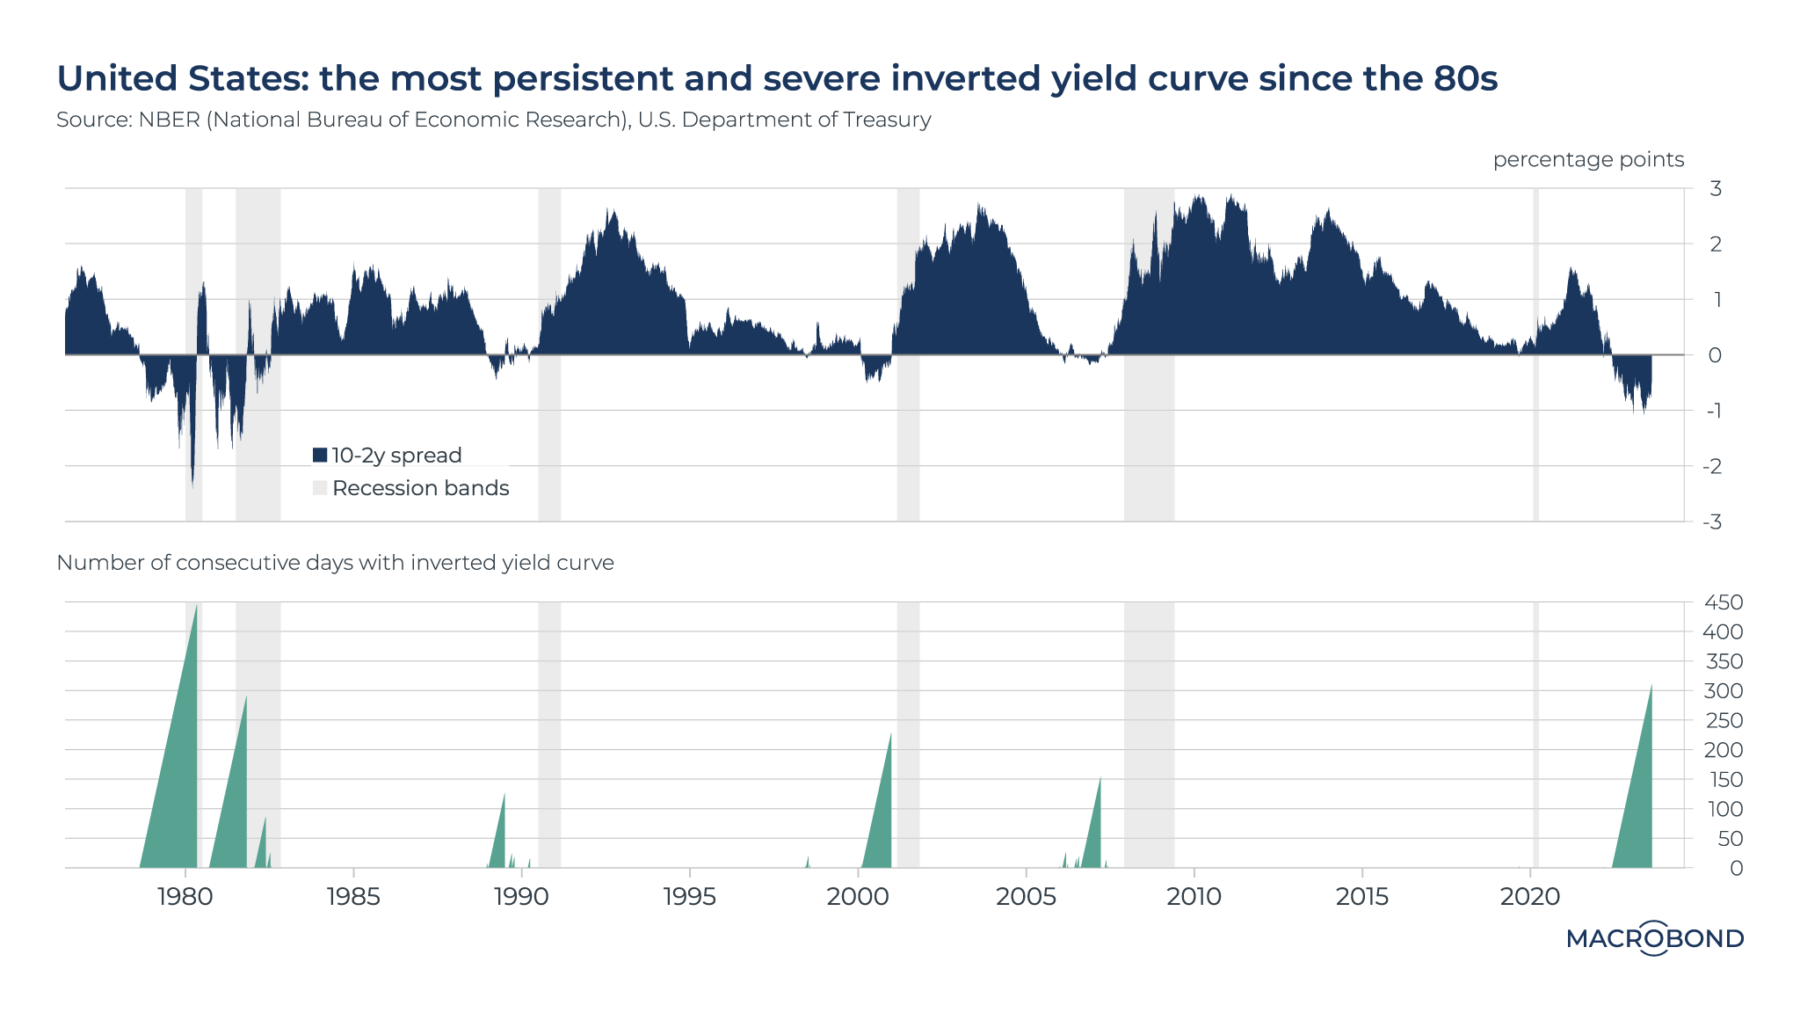
Nonetheless, it remains imperative to keep our attention firmly fixed on the invertedUS yield curve, as its persistence and severity surpasses what we've seen since the Volcker era.
 Indeed, the inverted yield curve, a scenario where long-term interest rates dip below short-term interest rates, has consistently served as a "reliable" harbinger of an impending recession. Throughout this year, there has been extensive discussion about this inversion becoming a somewhat regular feature of the market landscape.
A cursory look at historical data reveals instances of the 10-2 spread turning negative, such as during the 1970s when Paul Volcker presided over the Fed. Subsequently, we've seen smaller inversions in the 1990s, 2000, and during the great financial crisis.
Additionally, when we assess the duration of consecutive days during which the yield curve remains inverted, we find that the current streak has exceeded 300 days, marking the lengthiest inversion since 1980.
However, the market's signals have been persistently signaling an impending recession for months. An article by Goldman Sachs (NYSE: GS) challenges the predictive ability of the yield curve. It posits that, unlike in the past, it doesn't predict the future state of the economy but rather reflects the Fed's rate policy, acting as a sign of economic vulnerability rather than an imminent recession.
When 10-year yields dip below 2-year yields, it implies the market's anticipation of rate cuts. According to Hatzius, Goldman's chief economist, the probability of a U.S. recession in the next 12 months stands at a mere 20 percent.
“We don’t share the widespread concern about yield curve inversion,” he said last week.
“We do expect some deceleration in the next couple of quarters, mostly because of sequentially slower real disposable personal income growth — especially when adjusted for the resumption of student debt payments in October — and a drag from reduced bank lending. But the easing in financial conditions, the rebound in the housing market, and the ongoing boom in factory building all suggest that the US economy will continue to grow, albeit at a below-trend pace,” added Hatzius.
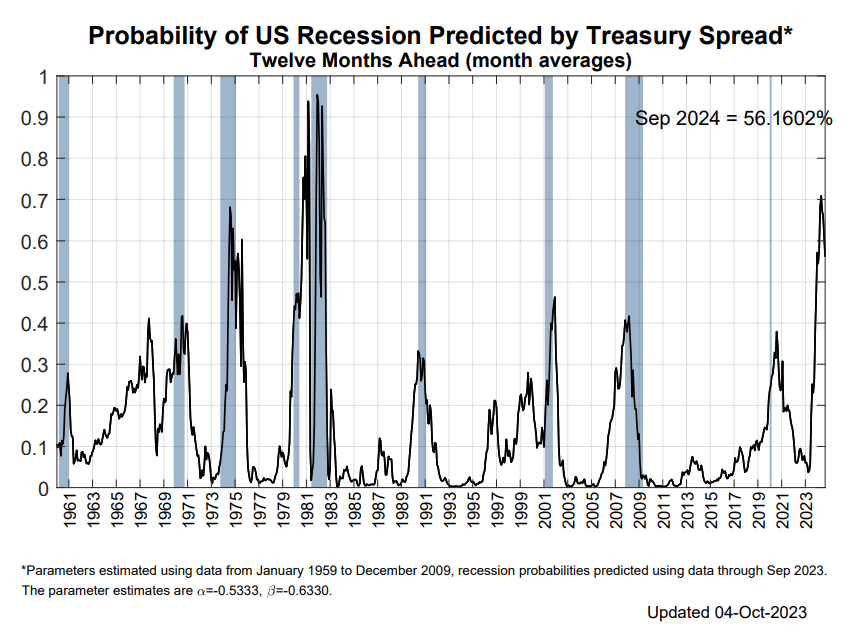
In contrast, using the New York Fed's yield curve model based on the spread between 3-month and 10-year yields, the probability of a recession in 2024 is estimated at 56 percent.

However, as ... argues, it will take only a few rate cuts to un-invert the curve:
“First, the term premium is well below its long-term average, so it takes fewer expected rate cuts to invert the curve. Second, there is a plausible path to Fed easing just on the back of lower inflation — in fact, both our and the FOMC’s nonrecession projections call for more than 200 basis points of gradual cuts in the next 2-3 years. Third, if forecasters are overly pessimistic now, rates market investors — and thus the expectations priced into the yield curve — are probably also overly pessimistic,” concluded Hatzius.
Regardless of who will prove correct in this debate, the main takeaway for trader is to not get too bearish right now — as you shouldn't have gotten too bullish a few month ago. Market sentiment comes and goes, but those who manage to keep their eyes on the long-term price are always the real winners.
Until next time!
***
Disclosure: This article is written for informational purposes only; it does not constitute a solicitation, offer, advice, or recommendation to invest as such it is not intended to incentivize the purchase of assets in any way. I would like to remind you that any type of asset, is evaluated from multiple points of view and is highly risky and therefore, any investment decision and the associated risk remains with the investor.

