- The S&P 500 and Nasdaq saw sharp losses two weeks ago, followed by their best weekly performances of the year last week.
- Key indicators like Bitcoin's recovery, surging Treasury bonds, and record highs in gold suggest a strong bullish market, with the Fed preparing to cut rates.
- With disinflation and possible Fed rate cuts ahead, resilient macroeconomic conditions are expected to sustain the bullish market through potential corrections.
We've truly been on a roller coaster these past two weeks:
- Two weeks ago: The S&P 500 had its worst week since March 2023, while the NASDAQ posted its worst since June 2022.
- Last week: The S&P 500's best week of the year, up 4% with daily gains across all sessions, and the Nasdaq also had its best, rising 6%.
Additionally, the Dow Jones Industrial Average had its second-highest daily close ever, Bitcoin is making a comeback, Treasury bonds are surging, gold is reaching all-time highs, and the Fed is preparing to cut rates.
What do these signs tell us about the strenght of the current long-term bull market?

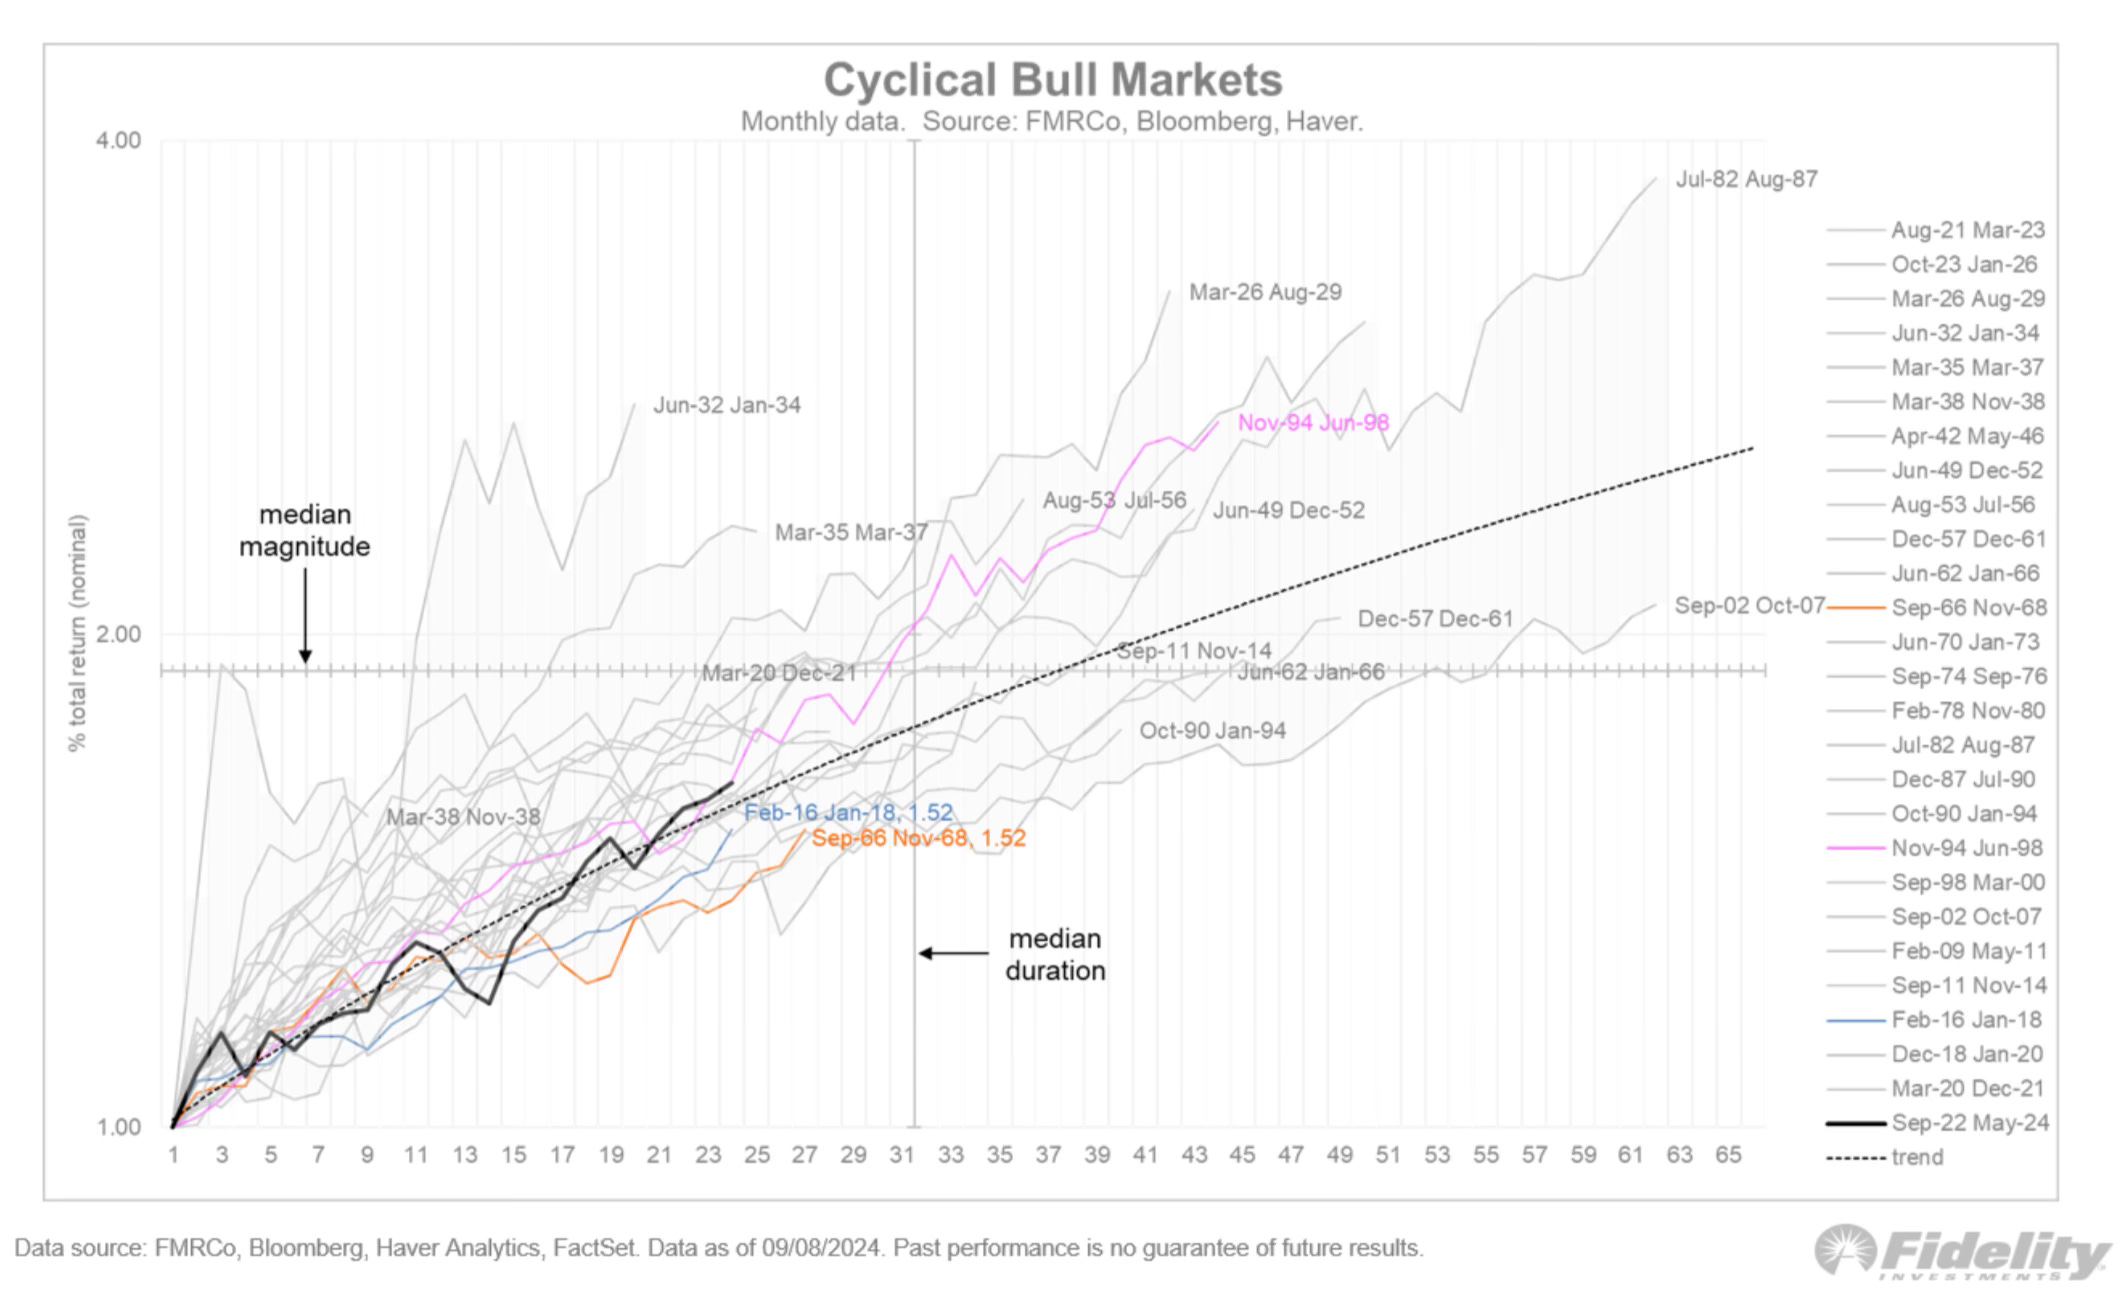
Currently, the duration of this bullish market (21 months) matches the shortest on record, with the last one ending in January 2022. However, the average length of a bullish market is 33 months, suggesting this cycle could extend until May 2025.
Historically, under similar conditions, the average gain during a bullish market is 63.6%, which would put the S&P 500 at 5,852 points.
The chart above shows exactly where we stand within a typical bullish cycle. After 21 months, it doesn't seem "old" enough for me to believe it's over. Fortunately, these developments shouldn't surprise anyone (I hope).
Furthermore, I expect current conditions to persist: resilient, dynamic macroeconomic data driving the bullish trend, alongside a disinflationary environment and strong earnings growth.
This should support a sustained upward movement. Of course, within this environment, asset prices will face corrections. We've just experienced one, and it appears the indexes are once again heading for new highs, as seen in recent quarters.
With that in mind, below are two key data points to keep an eye on right now for assessing the stock market's strength.
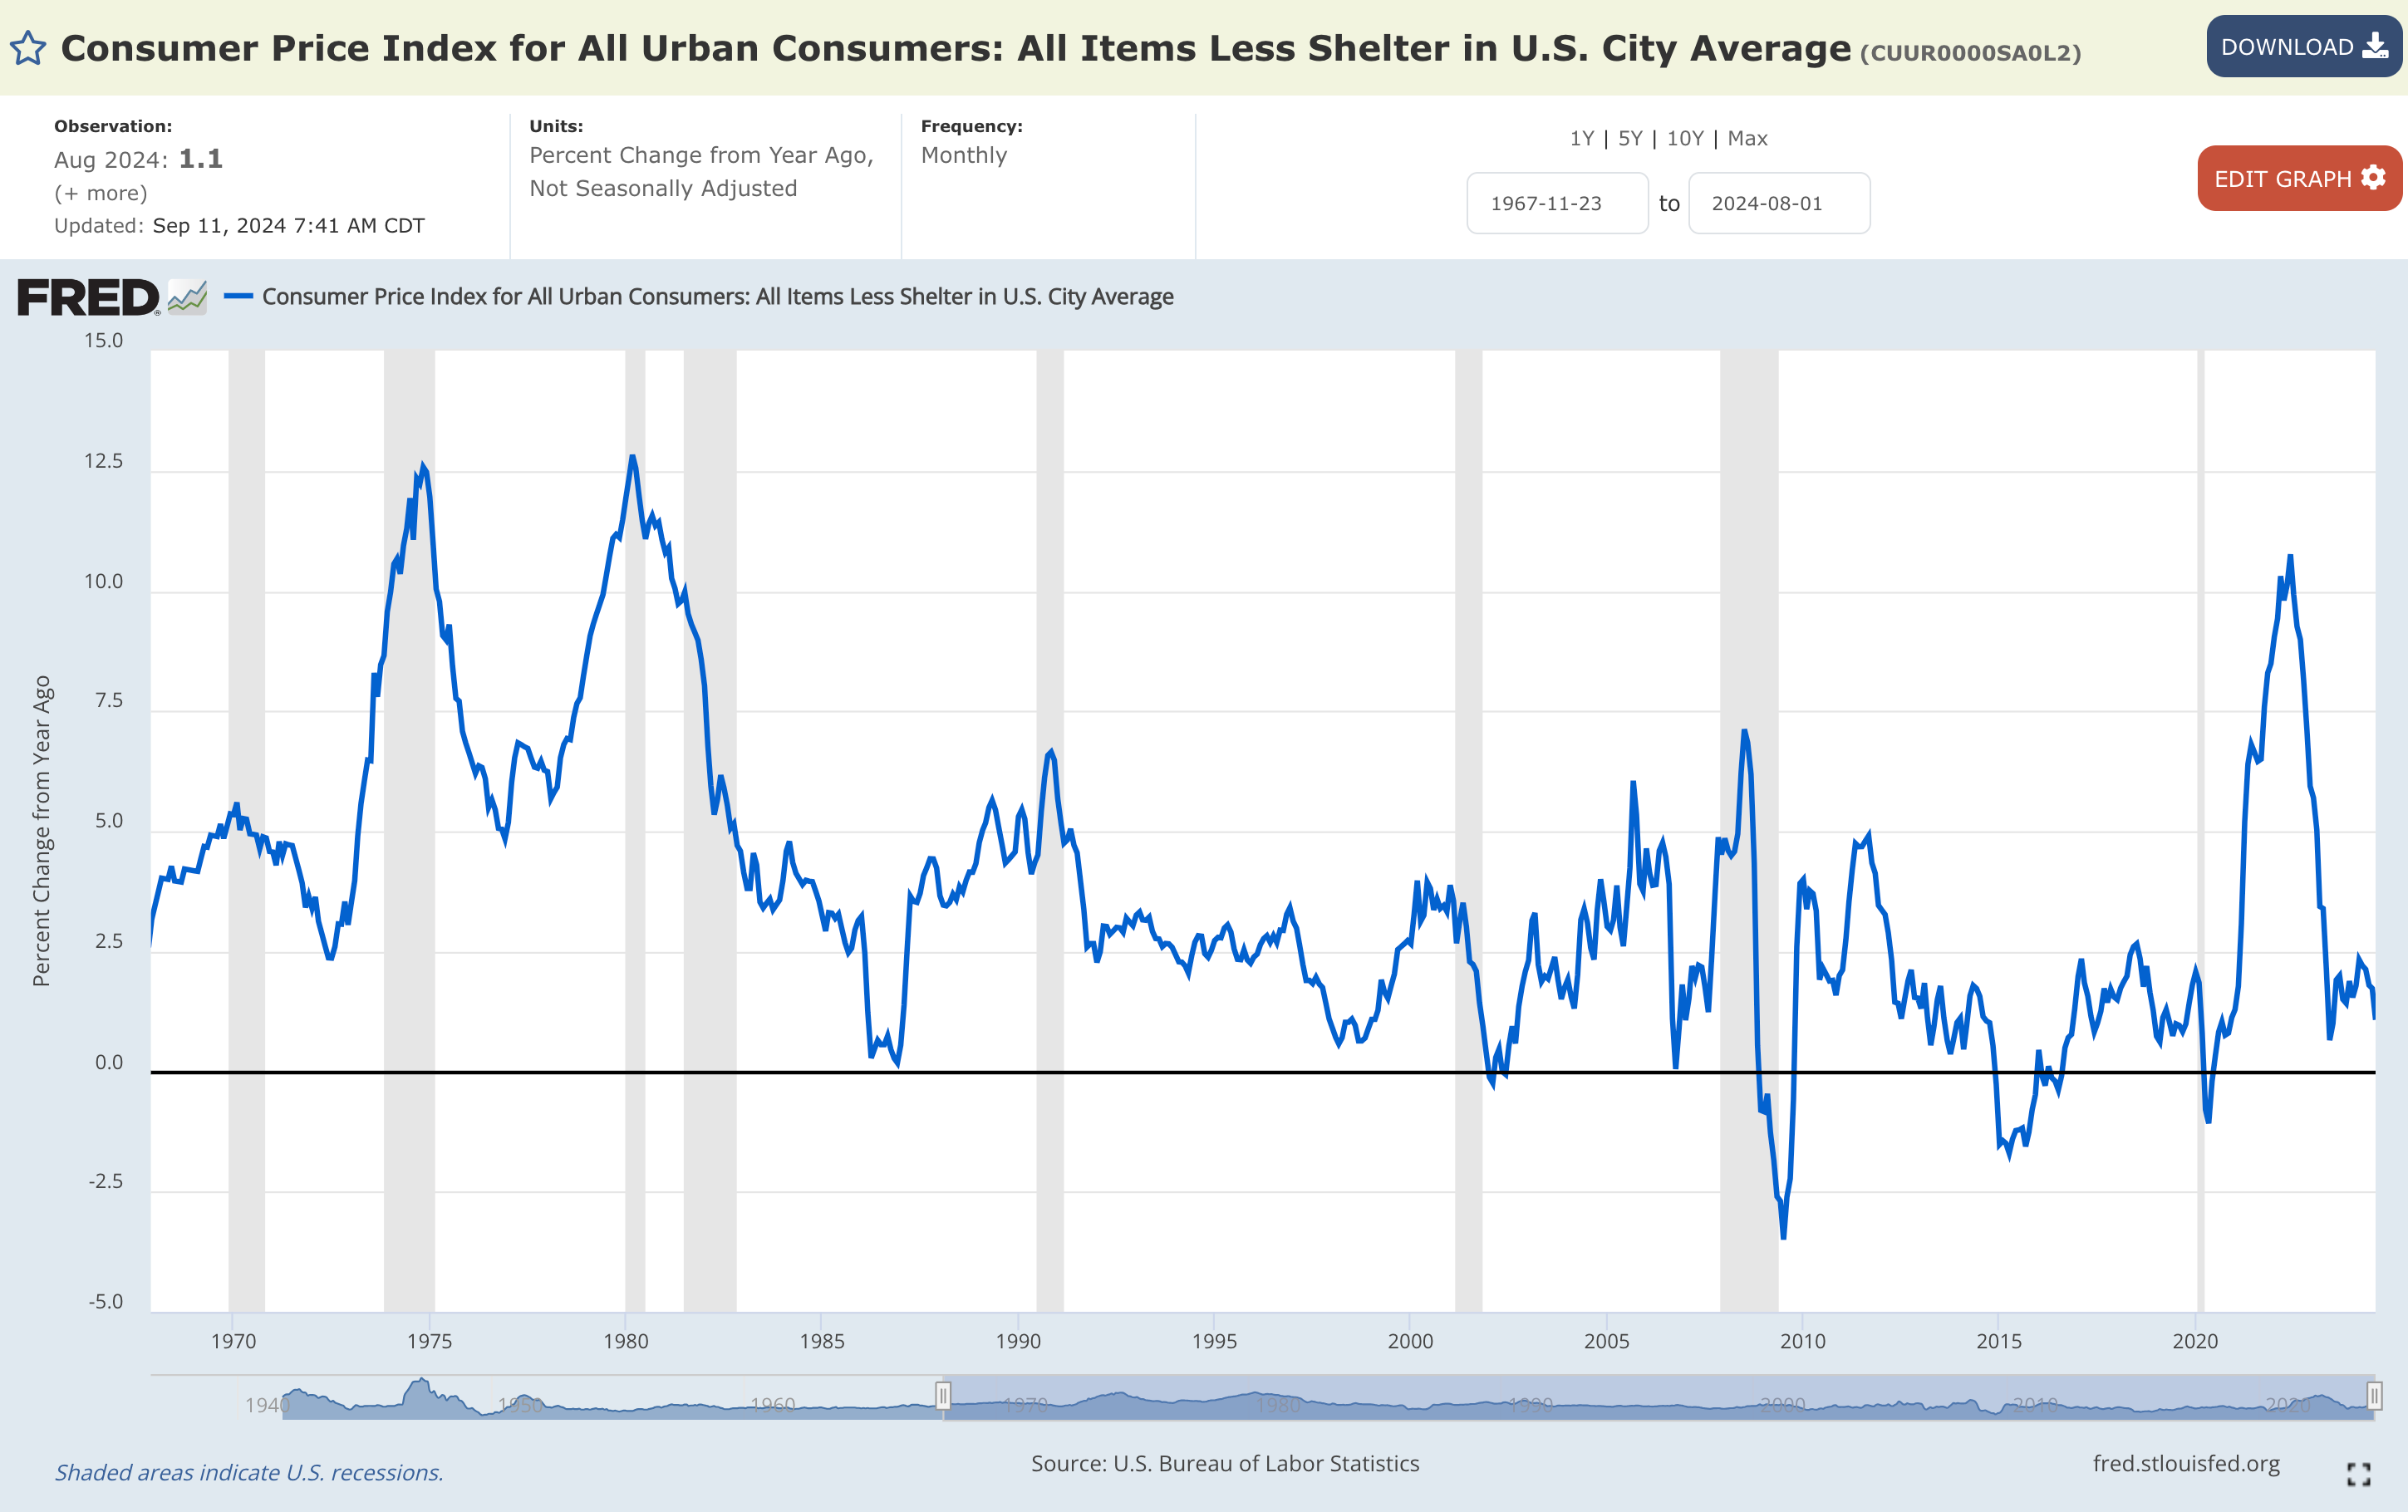
1. CPI ex-Shelter inflation was +1.07% year/year as of August 2024

These figures show clear disinflation, slowing from +1.73% year-over-year in July 2024.
Moreover, the chart highlights how the aggregate non-Shelter inflation rate is well below the Fed's 2% target, which is crucial given it’s the largest and most lagging component of the CPI basket.
That's not only below the Fed's target but also lower than the historical range from over 50 years ago.
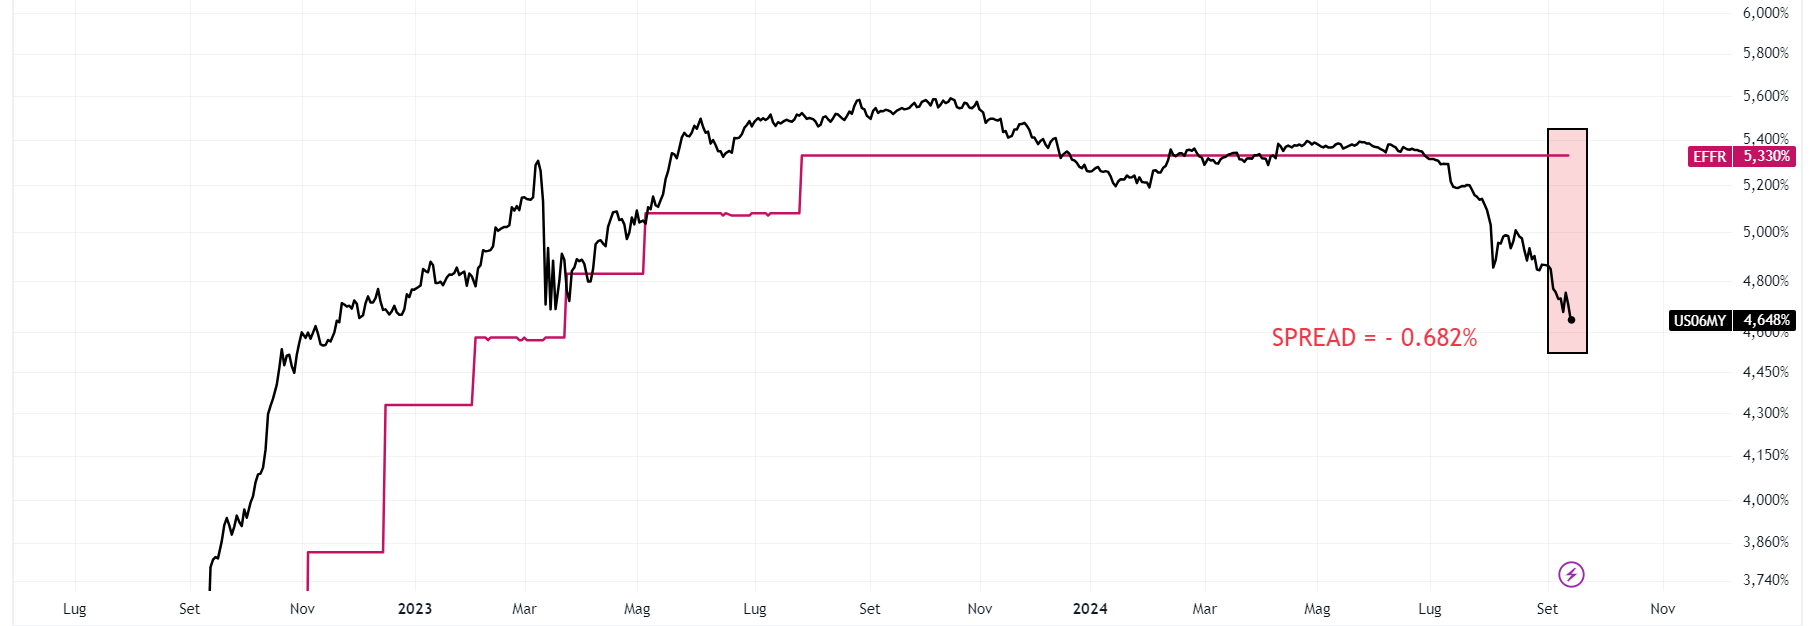
2. Relationship between the yield on 6-month Treasury bonds and Fed Funds

The chart shows the likelihood of Fed rate cuts totaling around 100 basis points over the next six months.
The spread between the 6-month yield and Fed Funds, currently around -0.7%, could hold steady after the upcoming 0.25% cut, signaling that an additional 0.7% reduction may follow in the next six months. Altogether, this points to a potential rate cut of about 1.0% over the next semester.
In conclusion, these indicators could prove the next bullish catalyst if macroeconomic conditions remain resilient.
"This article is written for informational purposes only; it does not constitute a solicitation, offer, advice, counseling or recommendation to invest as such it is not intended to incentivize the purchase of assets in any way. I would like to remind you that any type of asset, is evaluated from multiple points of view and is highly risky and therefore, any investment decision and the associated risk remains with the investor."
