-
Ethereum has shown resilience but potential risks loom.
-
Solana's upward momentum has slowed in March and a key support level awaits in case of a correction.
-
Dogecoin, after encountering resistance at $0.22, faces selling pressure too, with crucial support at $0.1688.
-
Invest like the big funds for less than $9 a month with our AI-powered ProPicks stock selection tool. Learn more here>>
After (Bitcoin) hit record highs at the latter part of March, cryptocurrency markets have been unstable, seeking a clear direction while forming lower highs and higher lows.
Despite the prevailing negative sentiment, altcoins like Ethereum, Solana, and Dogecoin continue to show solid trading volumes.
1. Ethereum
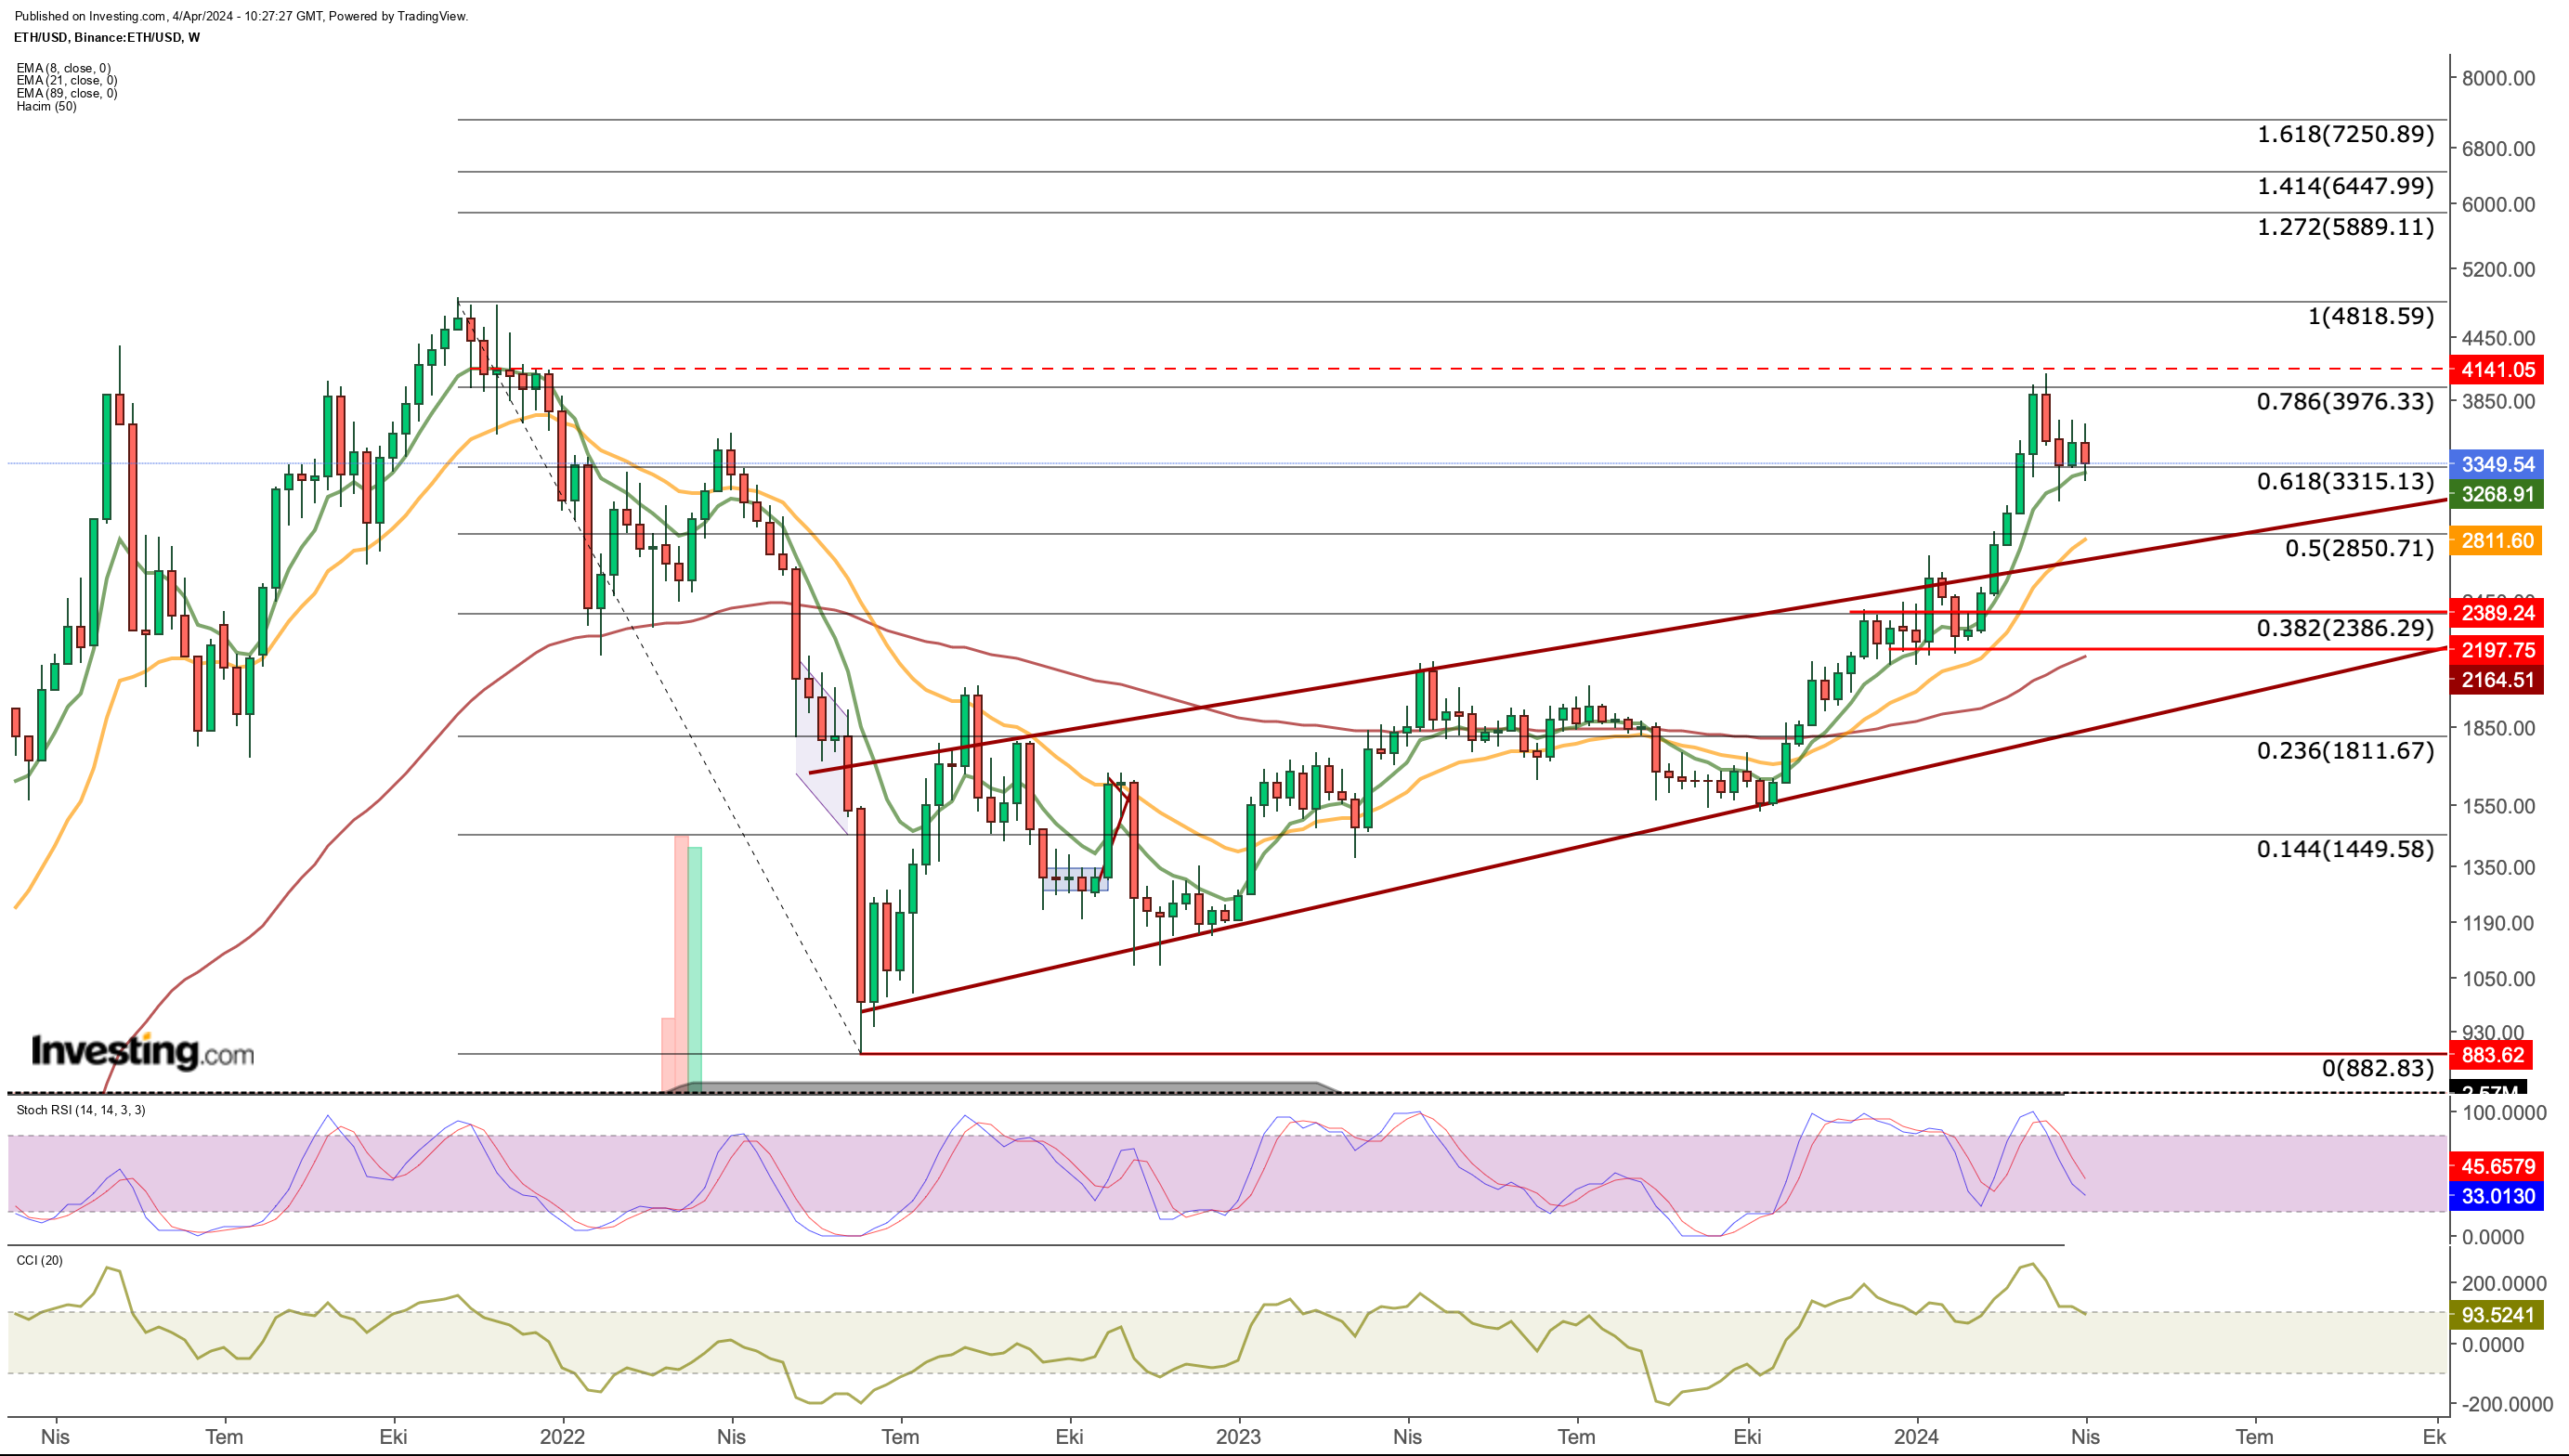
Ethereum has been oscillating between roughly $3,300 and $3,500 for the last 3 weeks. According to the recent uptrend, Ethereum is at risk of extending the correction if it closes this week below $3,500.

Looking at the long-term outlook, ETH started to retest the Fib 0.618 value after failing to break the resistance of about $ 3,975, which corresponds to a critical resistance of Fib 0.786 according to the bear market decline.
The price action since March 11 has also shown that these two values have yielded meaningful results.
So much so that in the last pullback, the $3,315 level has been working as support since the week of March 18. Short-term downside sags have so far been covered by the 8-week EMA, which is currently at $3.265.
In the coming days, ETH may once again test the resistance area at $3,975 - $4,150 as it finds support in the $3,265 - $3,315 range. Breaking the support zone with weekly closures may cause ETH to continue up to $ 2,800.
The $2,800 area stands as an extremely solid support line in terms of the 21-week EMA, Fib 0.5, and the upper line of the long-term ascending channel.
This means that in case of a possible sag below the $ 3,000 zone, we can see that reaction purchases may accelerate in the $ 2,800 zone.
2. Solana
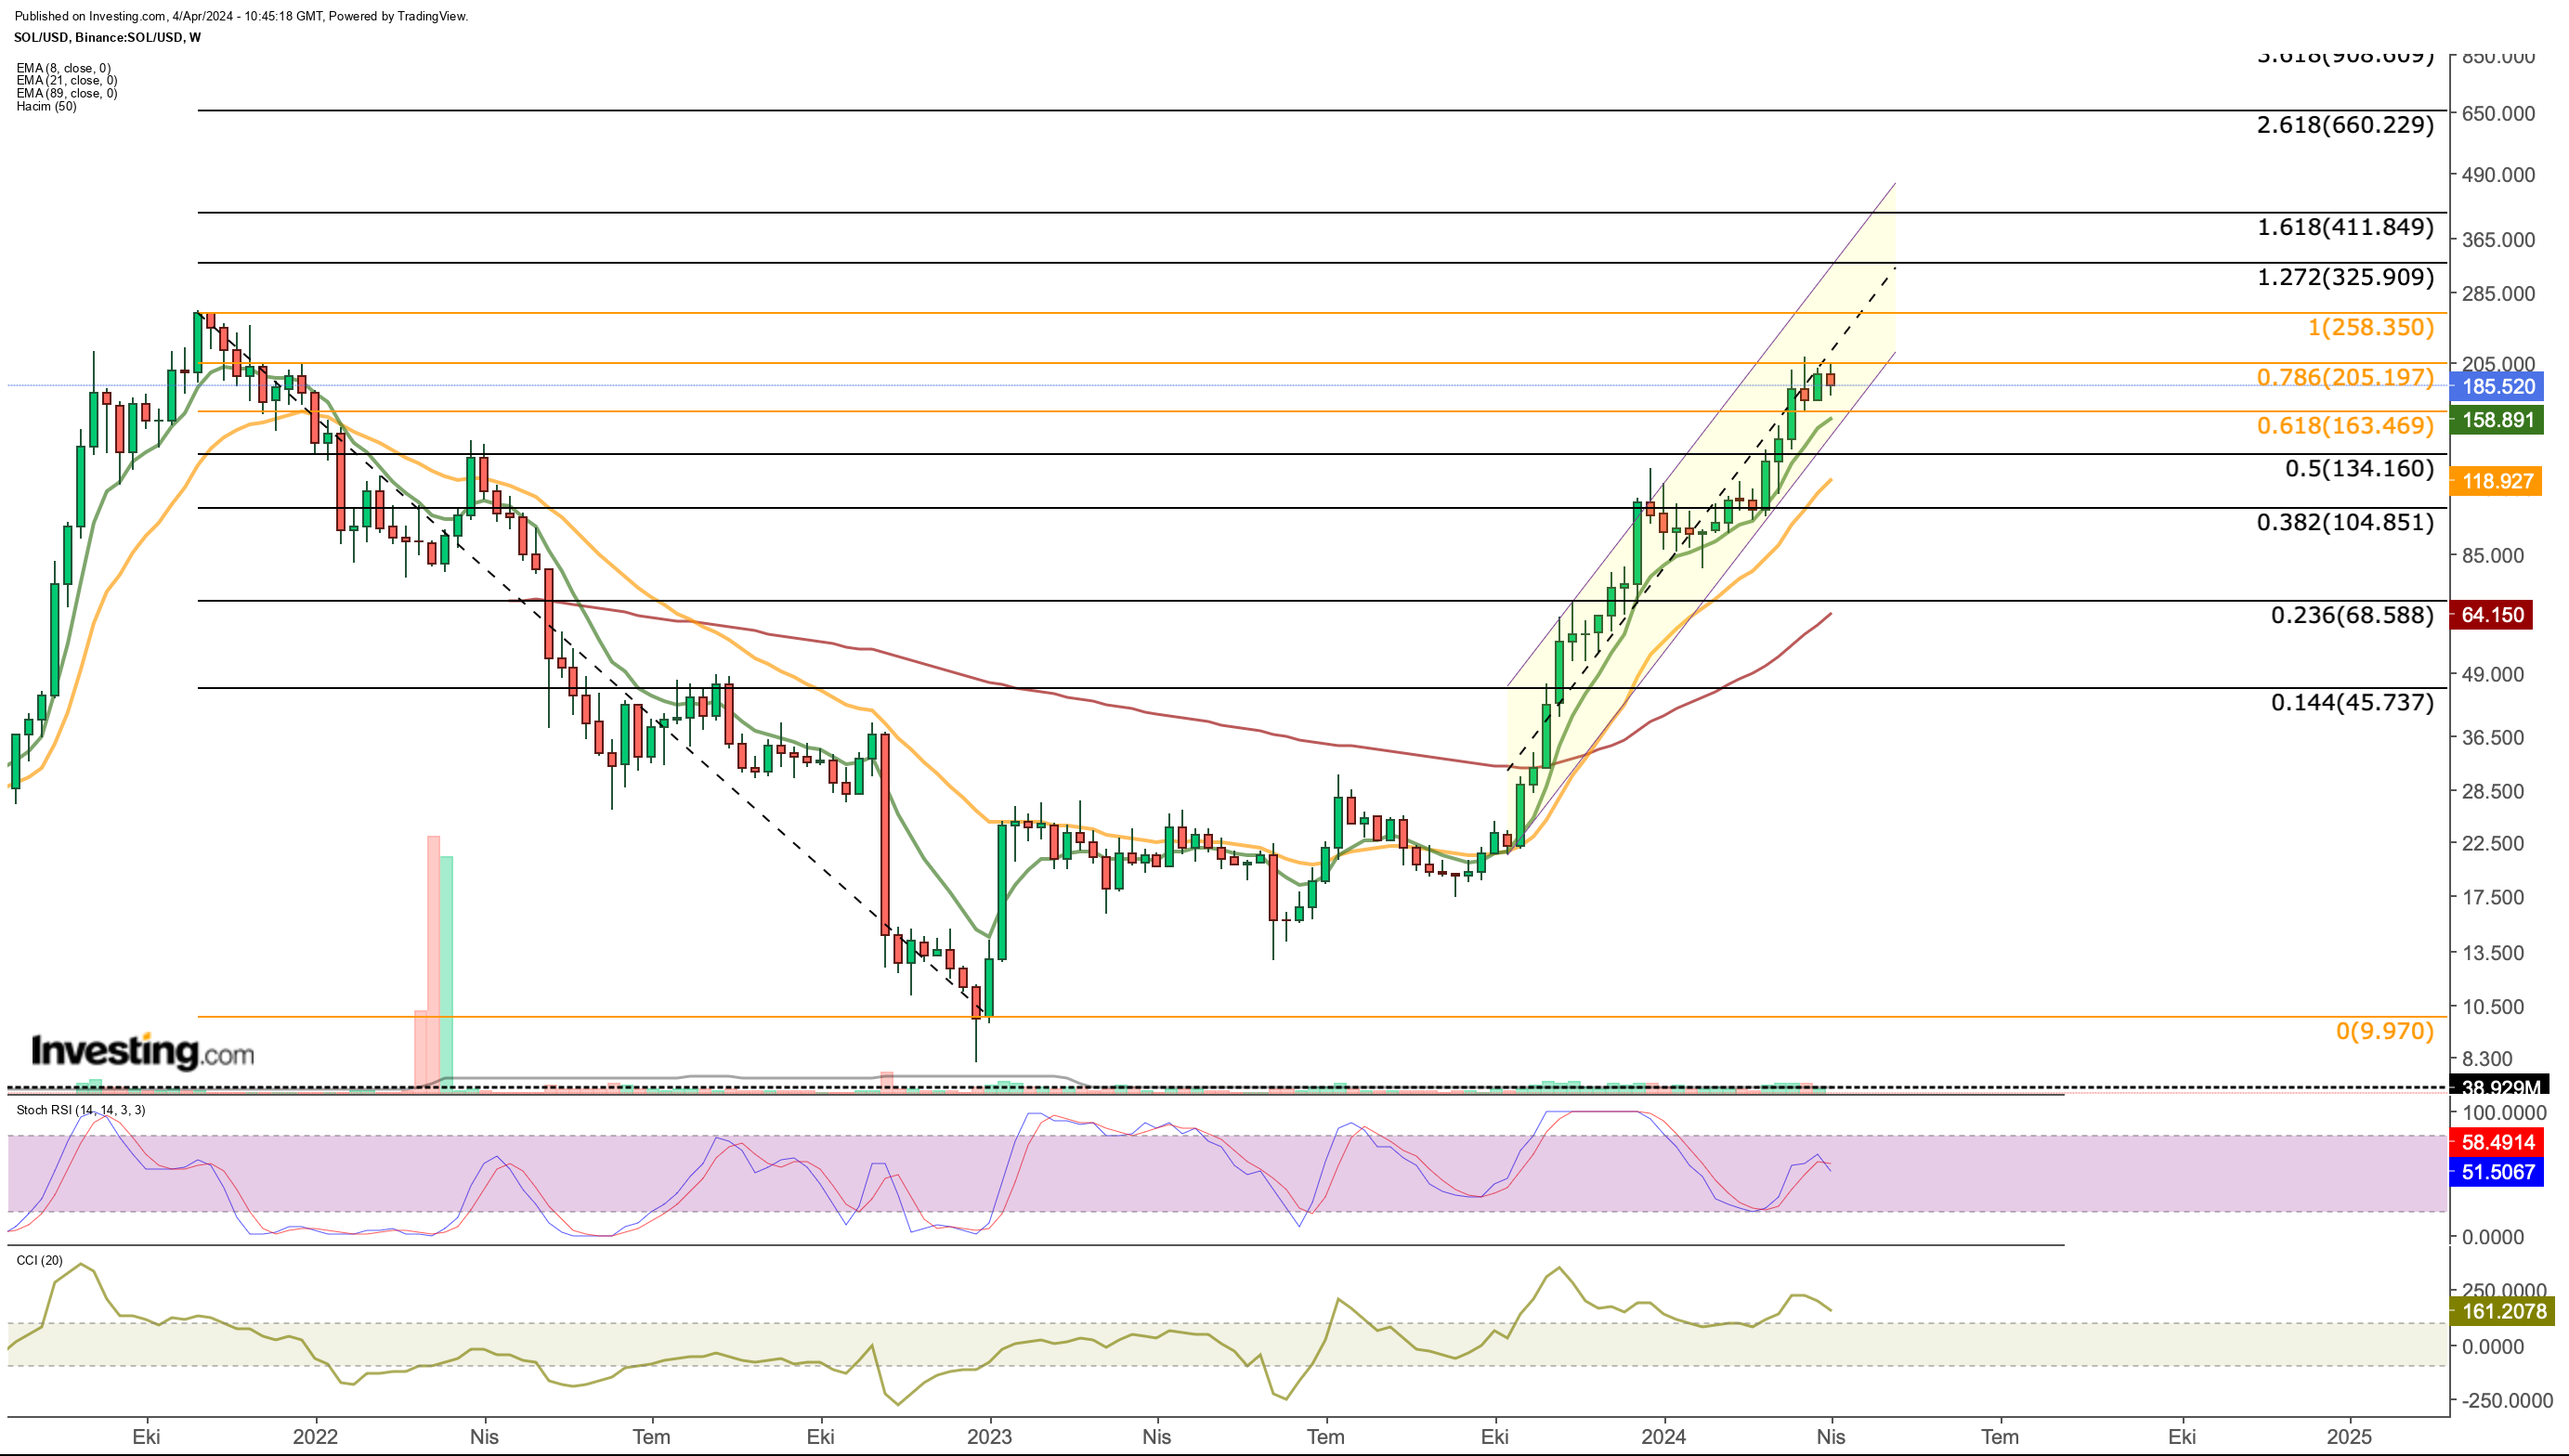
SOL, which continues its ascending channel movement, showed signs of slowing down in March but still maintained the uptrend.

SOL token continues to trade in the critical price zone based on the historical peak and bottom levels. In the current situation, we can see that an average of $205 (Fib 0.786) has been working as resistance since March.
The support point in the lower area, which has not yet been tested as demand remains strong, is at about $163.
If the next move is a weekly close above $205, we could see SOL test its peak near $260. The higher the volume reaches this point, the higher the probability that the peak will occur in a higher region.
If we look at possible target prices using Fibonacci levels; Above $ 258, the range of $ 325 - 410 draws attention.
In the lower region, if another wave of decline comes and SOL sees a weekly close below $ 163, $ 134 will be followed as the first support. In the possible breakout, we can see a sharp decline towards the $ 115 - 105 - 100 levels.
3. Dogecoin
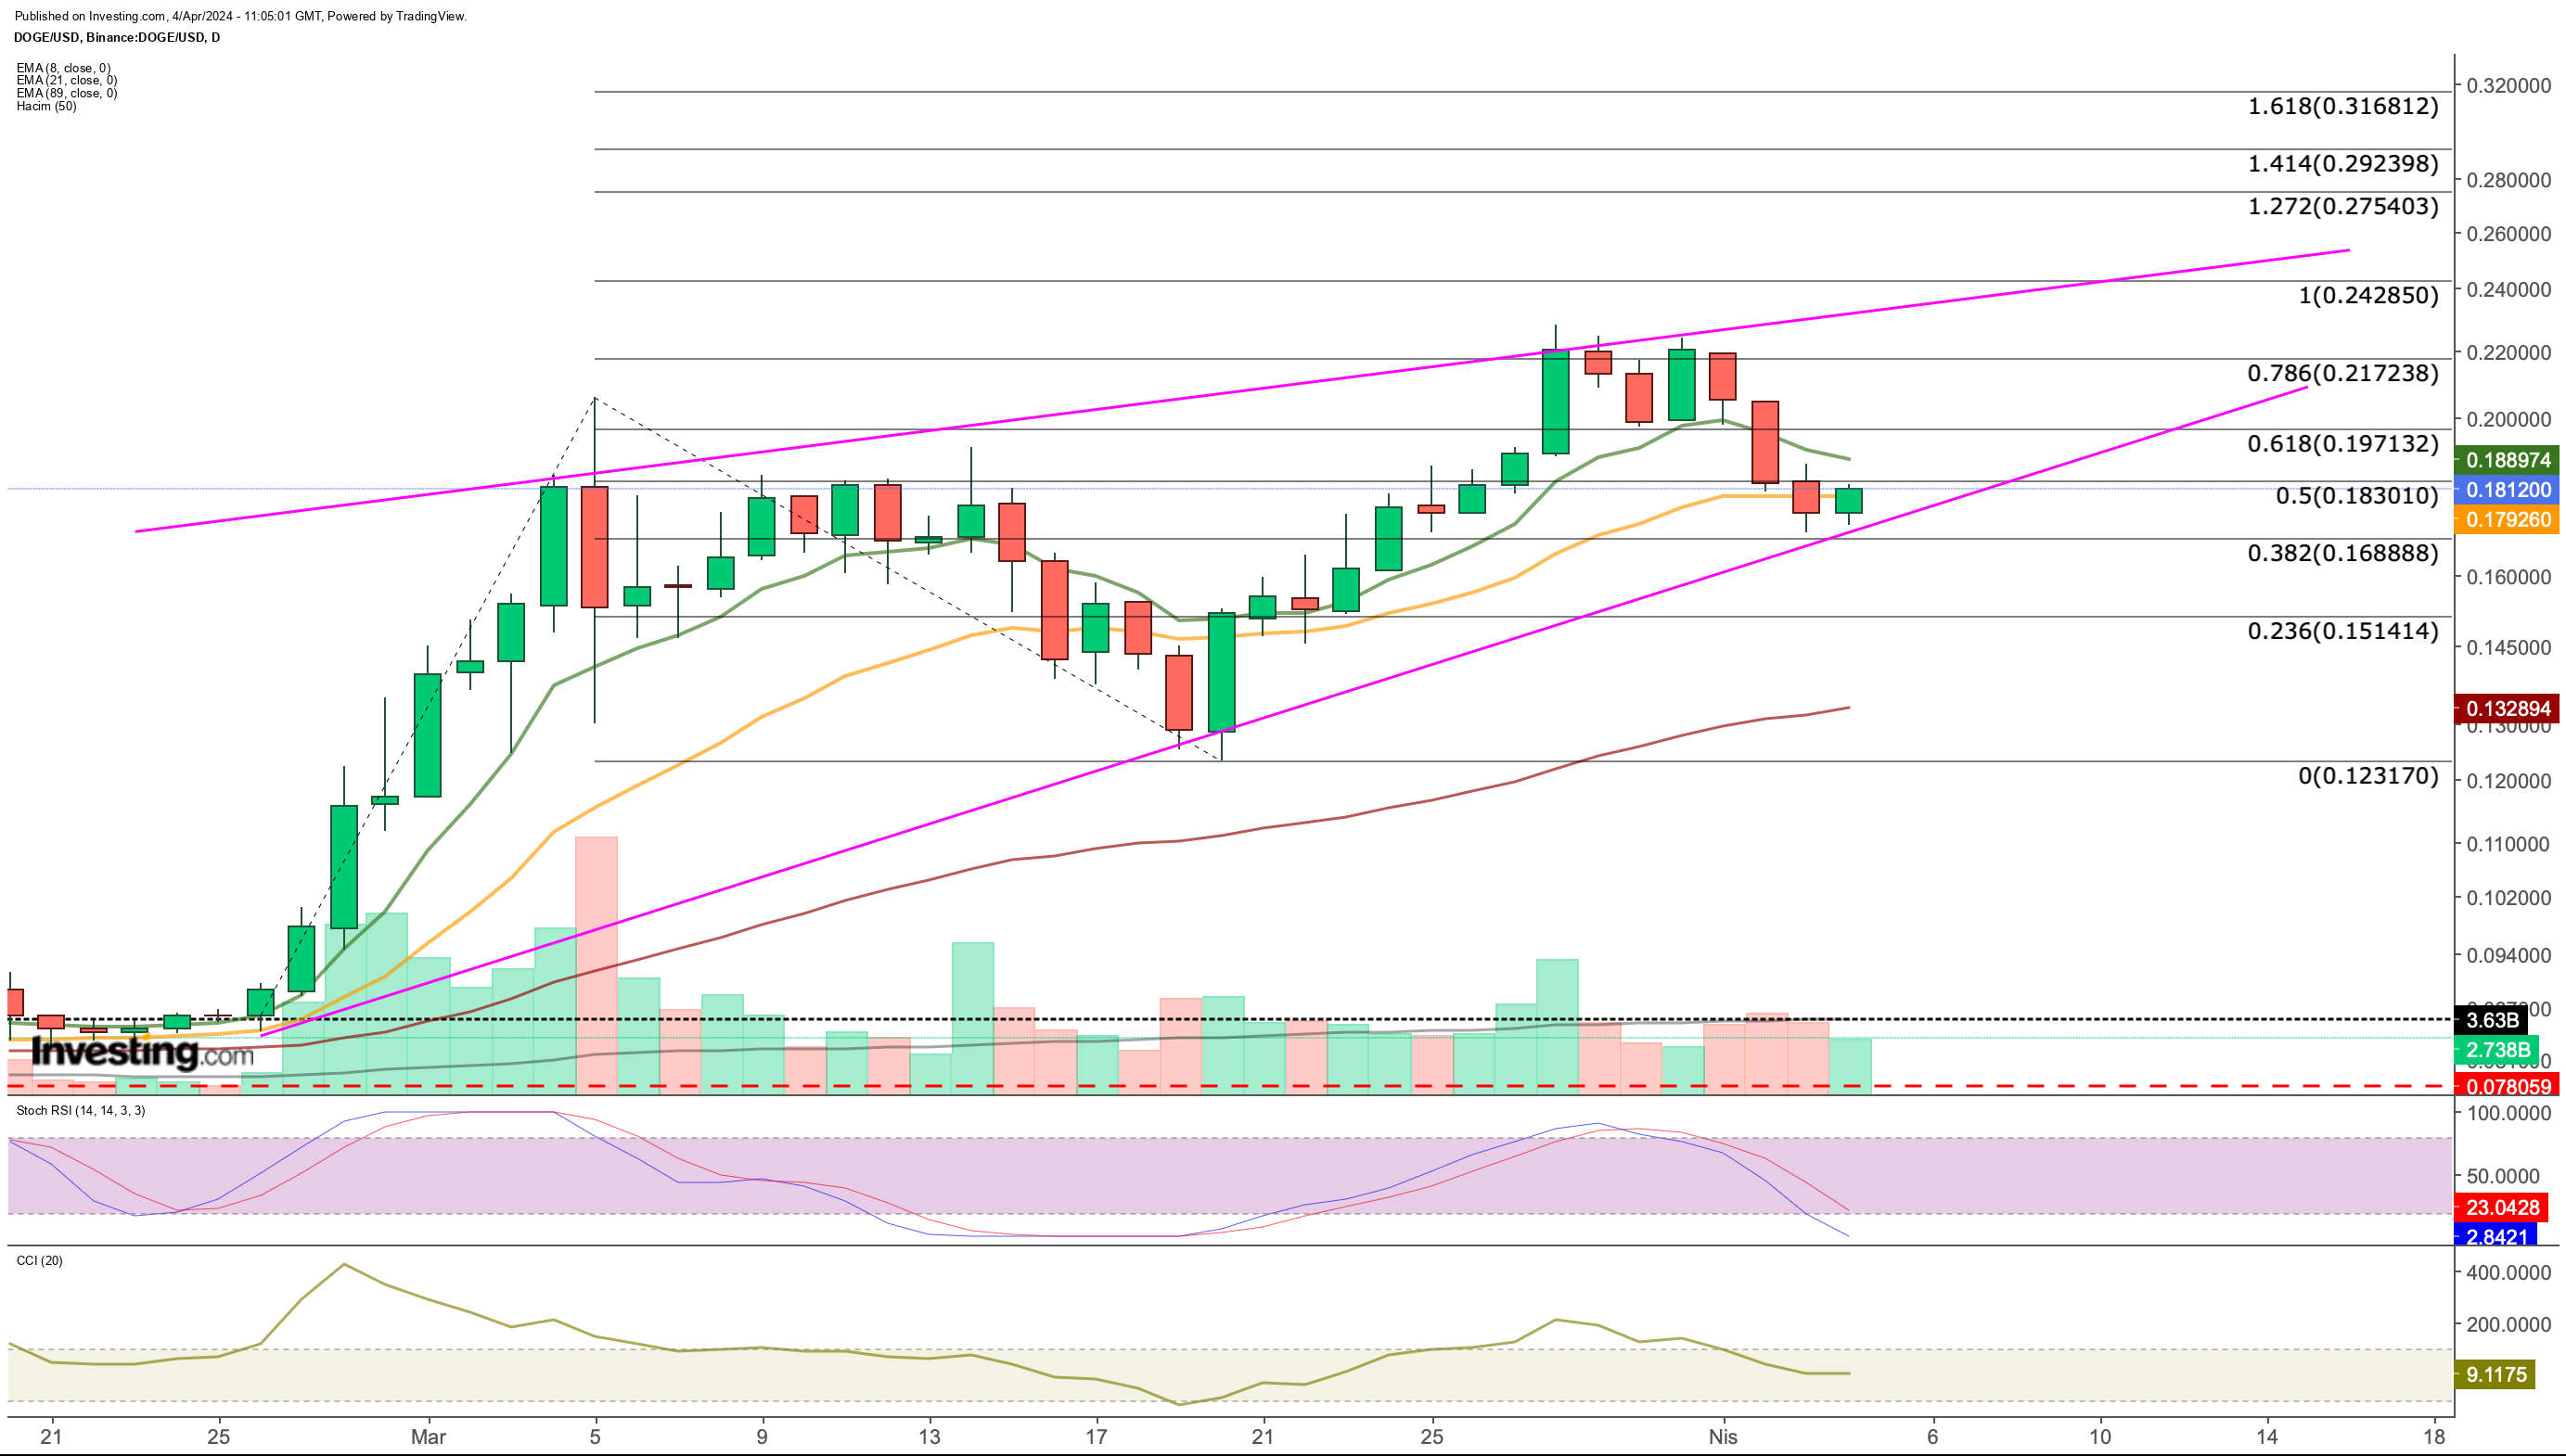
DOGE encountered resistance at the $0.22 level last week and this week has been seller-dominated alongside the general market trend.

In the last case, we could see a rebound from the $0.17 region. This area coincides with the trend line of late February origin, where DOGE's last uptrend began.
If DOGE, which is slightly positive today, can quickly cross the $0.18 zone once again, it could form its next local peak in the $0.24 region. This corresponds to a 30% rise if the pattern works.
On the other hand, a daily close below the $0.1688 level could invalidate the bullish setup.
Therefore, putting a stop below this area in possible buying positions offers an average risk premium of 8% from the current level.
The loss of the $0.1688 support could put DOGE at risk of falling to the $0.123 - $0.1328 range, taking into account the channel breakout.
To summarize; to confirm the start of the upmove in DOGE, $0.18 should be confirmed by the daily closing candle.
Then, we will see that the Stochastic RSI may also turn up on a daily basis and produce a solid signal for the upside. In the lower region, we mentioned that $ 0.1688 remains current as critical support.
***
Take your investing game to the next level in 2024 with ProPicks
Institutions and billionaire investors worldwide are already well ahead of the game when it comes to AI-powered investing, extensively using, customizing, and developing it to bulk up their returns and minimize losses.
Now, InvestingPro users can do just the same from the comfort of their own homes with our new flagship AI-powered stock-picking tool: ProPicks.
With our six strategies, including the flagship "Tech Titans," which outperformed the market by a lofty 1,745% over the last decade, investors have the best selection of stocks in the market at the tip of their fingers every month.
Subscribe here and never miss a bull market again!
Disclaimer: This article is written for informational purposes only; it does not constitute a solicitation, offer, advice, or recommendation to invest as such it is not intended to incentivize the purchase of assets in any way. I would like to remind you that any type of asset, is evaluated from multiple points of view and is highly risky and therefore, any investment decision and the associated risk remains with the investor.

