- This week and next, traders must understand that U.S. numbers will be skewed by the winter freeze that hampered oil production in Texas last week.
- Next week, traders should be prepared for news from OPEC+, which is trying to adjust to rising prices without scaring the market.
- Beyond next week, traders must consider that the currently-higher oil prices serve as an incentive to producers to aim for additional output.
1. U.S. Data and Lingering Texas Freeze Issues
Even though the weather crisis in Texas is over, traders should be aware that the EIA reports on oil and gasoline production in the U.S. will still look unusual this week and next week. Gasoline consumption data in the U.S. will also appear abnormally low for the previous week since Texas is the largest source of gasoline consumption in the U.S. Texas residents were not travelling much last week due to the frigid weather conditions.

Chart powered by TradingView
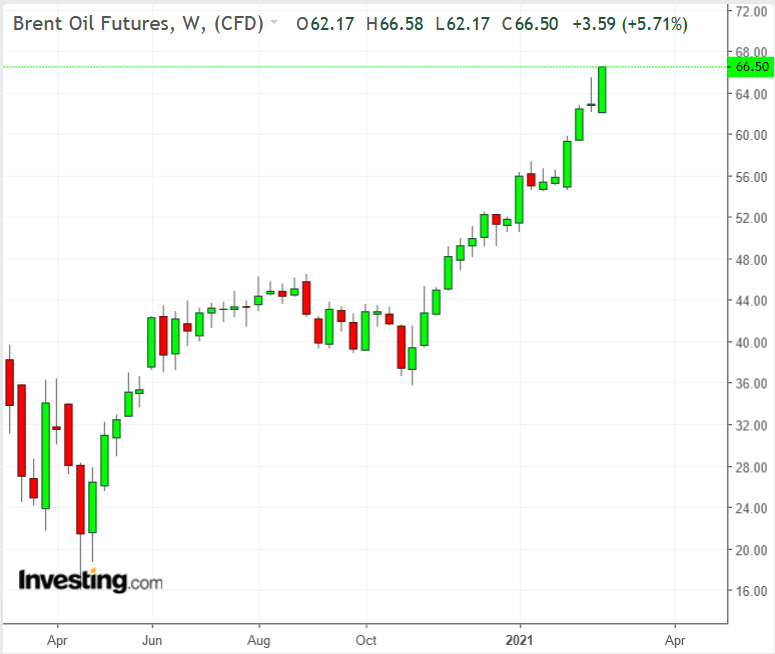
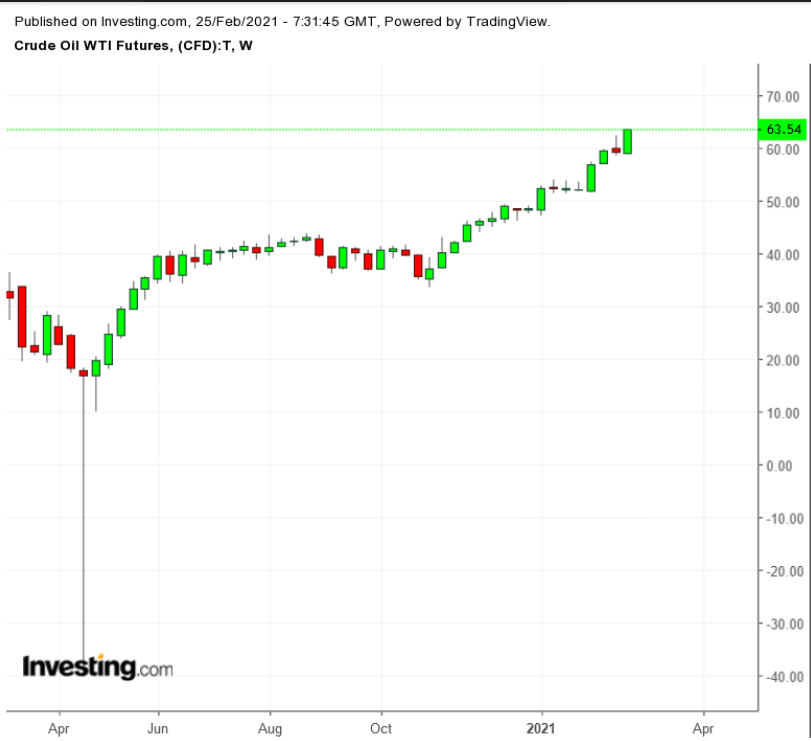
Oil prices continued to rise this week with both Brent and WTI hitting new highs of $66 and $63 per barrel, respectively, as of midday Wednesday. Some of the increase is due to the lingering impact of the Texas freeze on U.S. oil production, but there has also been a significant drawdown of crude oil and gasoline inventories in the U.S.
After hitting a peak in July 2020, inventories have decreased by about 195 million barrels, essentially erasing the buildup that occurred in the spring and summer of 2020.
2. March 4, OPEC+ Meeting
It increasingly looks as though the market could be undersupplied heading into the spring and summer months. OPEC+, which will be meeting next week on Mar. 4, will undoubtedly take this into consideration when deciding whether to raise oil production quotas starting Apr. 1.
Right now, OPEC+ is withholding about 7 million bpd from the market. According Reuters, OPEC+ producers will consider increasing oil production by a total of 500,000 bpd at their meeting next week. However, consensus is not assured. It is likely that Russia will push for a higher production increase, and Saudi Arabia will probably urge caution.
In addition to increasing overall OPEC+ production, Saudi Arabia plans to boost production to the level it was supposed to produce before it decided to cut an “extra” 1 million bpd of oil in February and March. This will likely happen in April.
There were some rumors that Saudi Arabia might increase production sooner than April, but the Saudis recently reassured the market that they remain committed to keeping the oil off the market until April.
Even though OPEC+’s Mar. 4 meeting is supposed to set production targets for April only, traders should keep open the possibility that OPEC+ will come up with a scheme to implement gradual increases in production from April through June as a compromise.
OPEC+ may also consider the possibility of including Iran in its production quotas soon. Though the Biden administration has not relaxed the sanctions on Iranian oil, there are indications that it might do so shortly. According to TankerTrackers.com, Iran exported 1.49 million bpd of crude oil in January, but, the country has the capacity to increase that amount if sanctions are relaxed.
3. Shale Production Prospects
Since oil prices started dropping in 2014 there has been a great deal of discussion about what price shale producers need in order to “break even” and to make a profit. Back in 2016, most shale oil projects were said to need oil prices in the $50 to mid-$60 per barrel range to be commercially viable. In 2020, half of all shale oil wells were said to be profitable at $40 per barrel.

Now that WTI is above $60 per barrel, will the companies producing in shale oil regions increase production? According to the EIA, oil production in the U.S. has been holding steady at around 11 million bpd. This is down from the 13 million bpd high attained last year. Even though many oil companies assured the market that rising oil prices would not tempt them to raise production this year, there are hints that producers will increase production, especially where new drilling isn’t required.
The CEO of Pioneer Natural Resources (NYSE:PXD), commented this week that he is confident that demand for oil will be strong enough that:
“U.S. shale is no longer going to be a threat to OPEC and OPEC+.”
Pioneer plans to increase its production by 5% a year in the long term, but given the CEO’s comment, it would not be surprising to see higher production growth in the short term given market conditions.
If shale producers raise production—and there is likely room for at least a 1 million bpd increase—supply will obviously increase. This would put downward pressure on prices. At $60+ per barrel prices, all traders need to keep an eye on production numbers.
