- Tech stocks suffered last week.
- Ahead of a key CPI report, market volatility could rise.
- During such times, low-beta stocks could make great additions to your portfolio.
- For less than $9 a month, InvestingPro's Fair Value tool helps you find which stocks to hold and which to dump at the click of a button.
The past week marked the worst performance for the Nasdaq since June 2022, with the tech and semiconductor sectors experiencing their sharpest decline since March 2020.
While this seems grim, it's worth noting that we saw a similar rough start just last month—perhaps a reminder not to lose optimism amidst the wave of pessimism.
The spotlight was on labor market data, where some metrics fell short of expectations.
However, employment growth held steady at 5.2%, wage growth outpaced inflation at 3.63%, and the unemployment rate ticked down from 4.3% to 4.2%.
This data suggests the economy could support at least a 0.25% rate cut at the upcoming FOMC meeting on September 18.
So, With Rate Cuts Right Around the Corner, Why Did Stocks Correct?
While there are many potential explanations for the market’s performance, the truth is, no one can say for sure.
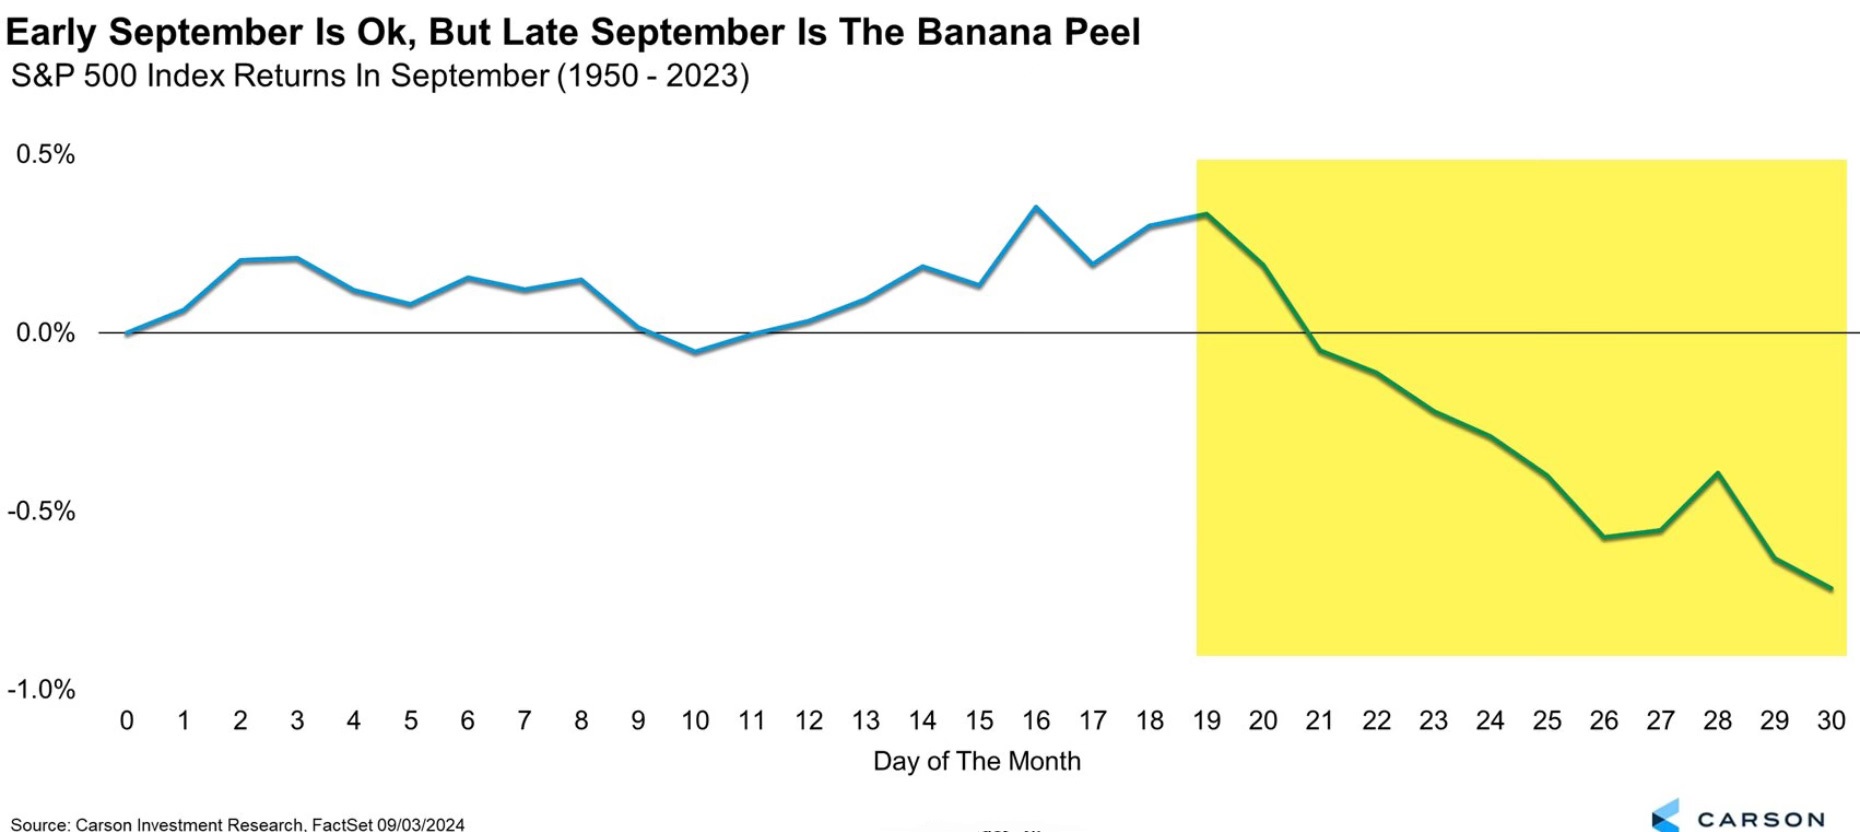
Historically, September has been one of the worst months for the market, dating back to 1950. This year, the decline started early, catching some off guard as the dip usually occurs in the second half of the month.

Seasonality suggests more volatility could lie ahead, possibly driving the S&P 500 toward August lows.
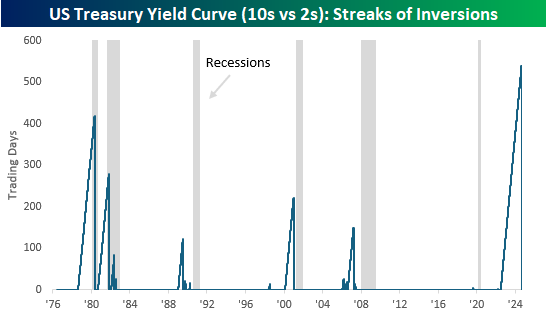
Additionally, the long stretch of 545 consecutive days with an inverted yield curve—a new record surpassing the previous streak of 419 days from the late 1970s and 1980s—has officially ended.
Since World War II, most recessions have followed shortly after the yield curve turned positive, signaling potential uncertainty ahead for the stock market.

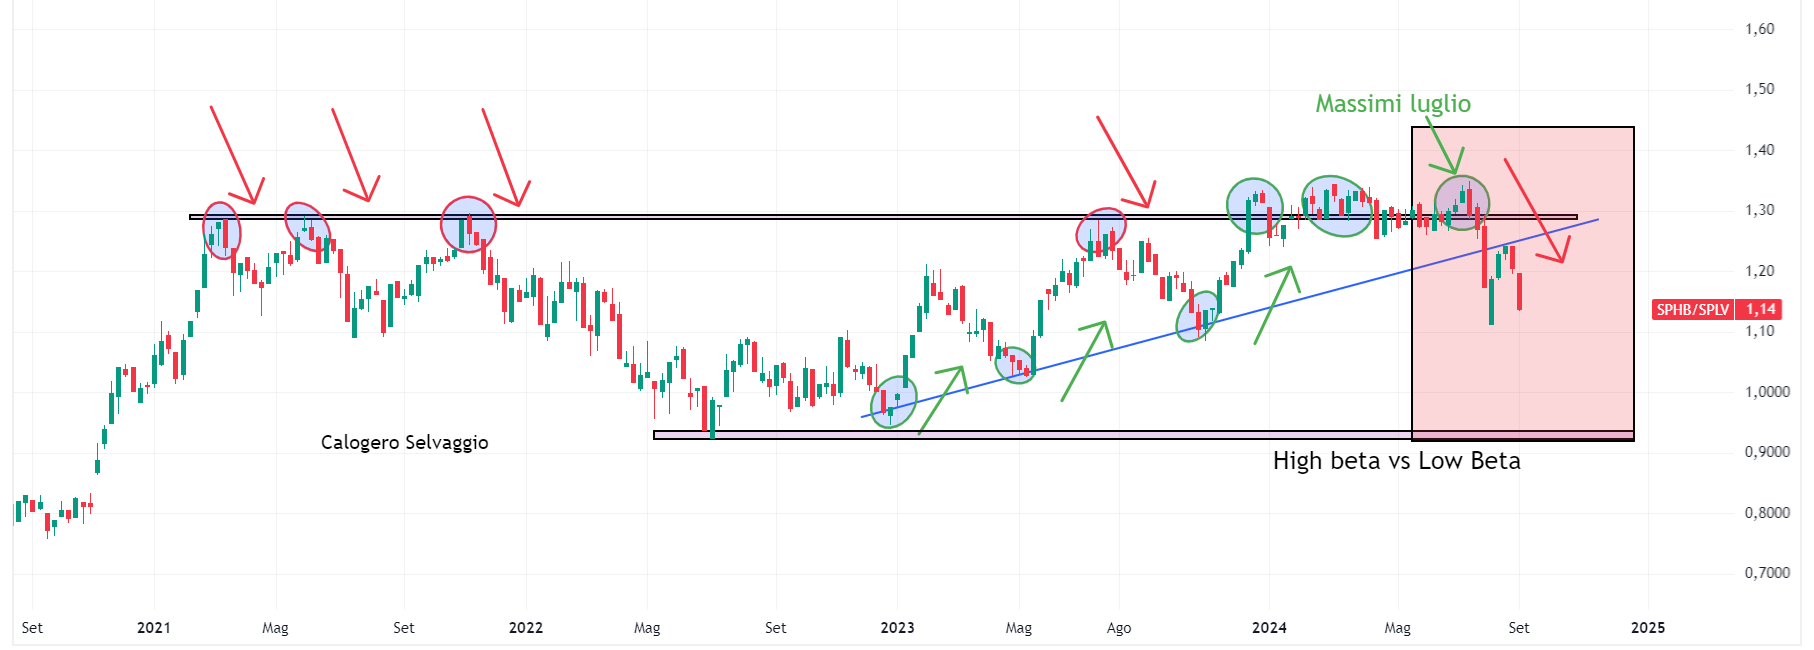
This uncertainty is evident in high-beta stocks (NYSE:SPHB), which have struggled in comparison to their low-beta (NYSE:SPLV) counterparts.
Beta, a measure of a stock’s volatility relative to its benchmark, is one of my preferred indicators of market risk appetite.

Back in July, I noted how the beta ratio hit new all-time highs, signaling a bullish trend that lasted for months.
However, the recent shift in favor of low-beta stocks has broken that bullish trend line established in December 2022, signaling short-term weakness, though not yet a full market correction.
Here are the top 10 holdings in the Low Volatility ETF:
- Berkshire Hathaway (NYSE:BRKa)
- The Coca-Cola Company (NYSE:KO)
- T-Mobile US (NASDAQ:TMUS)
- Loews Corporation (NYSE:L)
- Republic Services Inc (NYSE:RSG)
- Visa Inc (NYSE:V)
- Colgate-Palmolive Company (NYSE:CL)
- Marsh & McLennan Companies Inc
- The Procter & Gamble Company
- Linde (NYSE:LIN)
These low-beta stocks could continue to be favored as the market shifts toward less volatility.
The combined performance of these stocks over the past five years—and even more so in the past year—has outpaced the S&P 500, with smaller declines during market weakness and faster recoveries.
These stocks may continue to benefit from the shift toward low Beta, making them ones to add to your watchlist, like I did with mine.

You can view the full Pro Watchlist here.
Looking at the performance of these stocks over the last five years, their overall trend has been positive, especially during periods of market weakness.
Compared to the S&P 500, their declines have been smaller, and they’ve bounced back more quickly.
Lowe's (NYSE:LOW) Stands Out for Upside Potential
When ranking these stocks by Beta and growth rate, Loews Corp (NYSE:L) stands out. This bullish outlook is supported by the stock's solid financial health score of 3 out of 5, indicating good financial performance.

Additionally, its low price-to-earnings (P/E) ratio suggests the stock may be undervalued, offering further growth opportunities.
Loews' profitability over the past 12 months also bodes well. A profitable company has the potential to generate excess cash, which can be used to reinvest in growth, pay dividends, or buy back shares.

Comparing Loews’ P/E ratio to similar companies in its industry will give us a better idea of whether it truly presents a bargain or if the market is pricing in potential challenges ahead.
***
Whether you're a novice investor or a seasoned trader, leveraging InvestingPro can unlock a world of investment opportunities while minimizing risks amid the challenging market backdrop.
Subscribe and unlock access to several market-beating features, including:
- InvestingPro Fair Value: Instantly find out if a stock is underpriced or overvalued.
- AI ProPicks: AI-selected stock winners with proven track record.
- Advanced Stock Screener: Search for the best stocks based on hundreds of selected filters, and criteria.
- Top Ideas: See what stocks billionaire investors such as Warren Buffett, Michael Burry, and George Soros are buying.
Disclaimer: This article is written for informational purposes only; it does not constitute a solicitation, offer, advice, counsel or recommendation to invest as such it is not intended to incentivize the purchase of assets in any way. I would like to remind you that any type of asset, is evaluated from multiple perspectives and is highly risky and therefore, any investment decision and the associated risk remains with the investor.
