
This article was written exclusively for Investing.com
- Leading cryptos corrected sharply over the past weeks
- A sign of buying on the dip
- The Graph (GRT) is a top-tier crypto in 52nd place
- Hedera Hashgraph (HBAR) just behind GRT
- A reminder of the risk
China is about to roll out a digital yuan, making the world’s second-leading economy the first to embrace fintech. After making highs in April and May, Bitcoin and Ethereum prices suffered substantial corrections. The Chinese ban on crypto mining and a crackdown on the asset class is likely responsible for selling that more than halved prices from the 2021 all-time highs.
The move lower may have shaken the confidence of latecomers to the asset class. Still, many consider it an opportunity to load up on Bitcoin, Ethereum, and many of the over 10,700 other cryptocurrencies.
Many will become dust collectors and place keepers in computer wallets as they fade into obscurity in cyberspace. However, there will be diamonds in the rough that deliver fantastic returns.
Two cryptocurrencies in the top one-half of one percent when it comes to market cap are The Graph (GRT) and Hedera Hashgraph (HBAR). Both have market caps above the $1.5 billion level as of July 1, which reflect their critical mass and position as leading cryptocurrencies.
Leading cryptos corrected sharply over the past weeks
While prices have bounced from the recent low, the trends in Bitcoin and Ethereum, the two top cryptocurrencies, remain lower since the mid-April and mid-May highs.

Source, next five charts: CQG
The chart highlights the decline of July Bitcoin futures from a high of $67,010 on Apr. 14 to a low of $28,840 on June 22. Bitcoin futures were trading around the $36,090 level on June 29, a lot closer to the low than the high since mid-April. 
July Ethereum futures plunged from $4,418 on May 12 to a low of $1,710.75 on June 22. At the $2,190 level on June 29, the price is less than half the level at the high and not far from the recent low.
After the parabolic moves in 2021, Bitcoin and Ethereum prices came back down to earth. However, both cryptocurrencies continue to provide incredible returns for investors who had the foresight to buy over the past years.
Sign of long liquidation
While the futures market only provides a microcosm of the trading activity in Bitcoin and Ethereum, it provides clues about investor and trader behavior. Open interest is the total number of open long and short positions in a futures market. 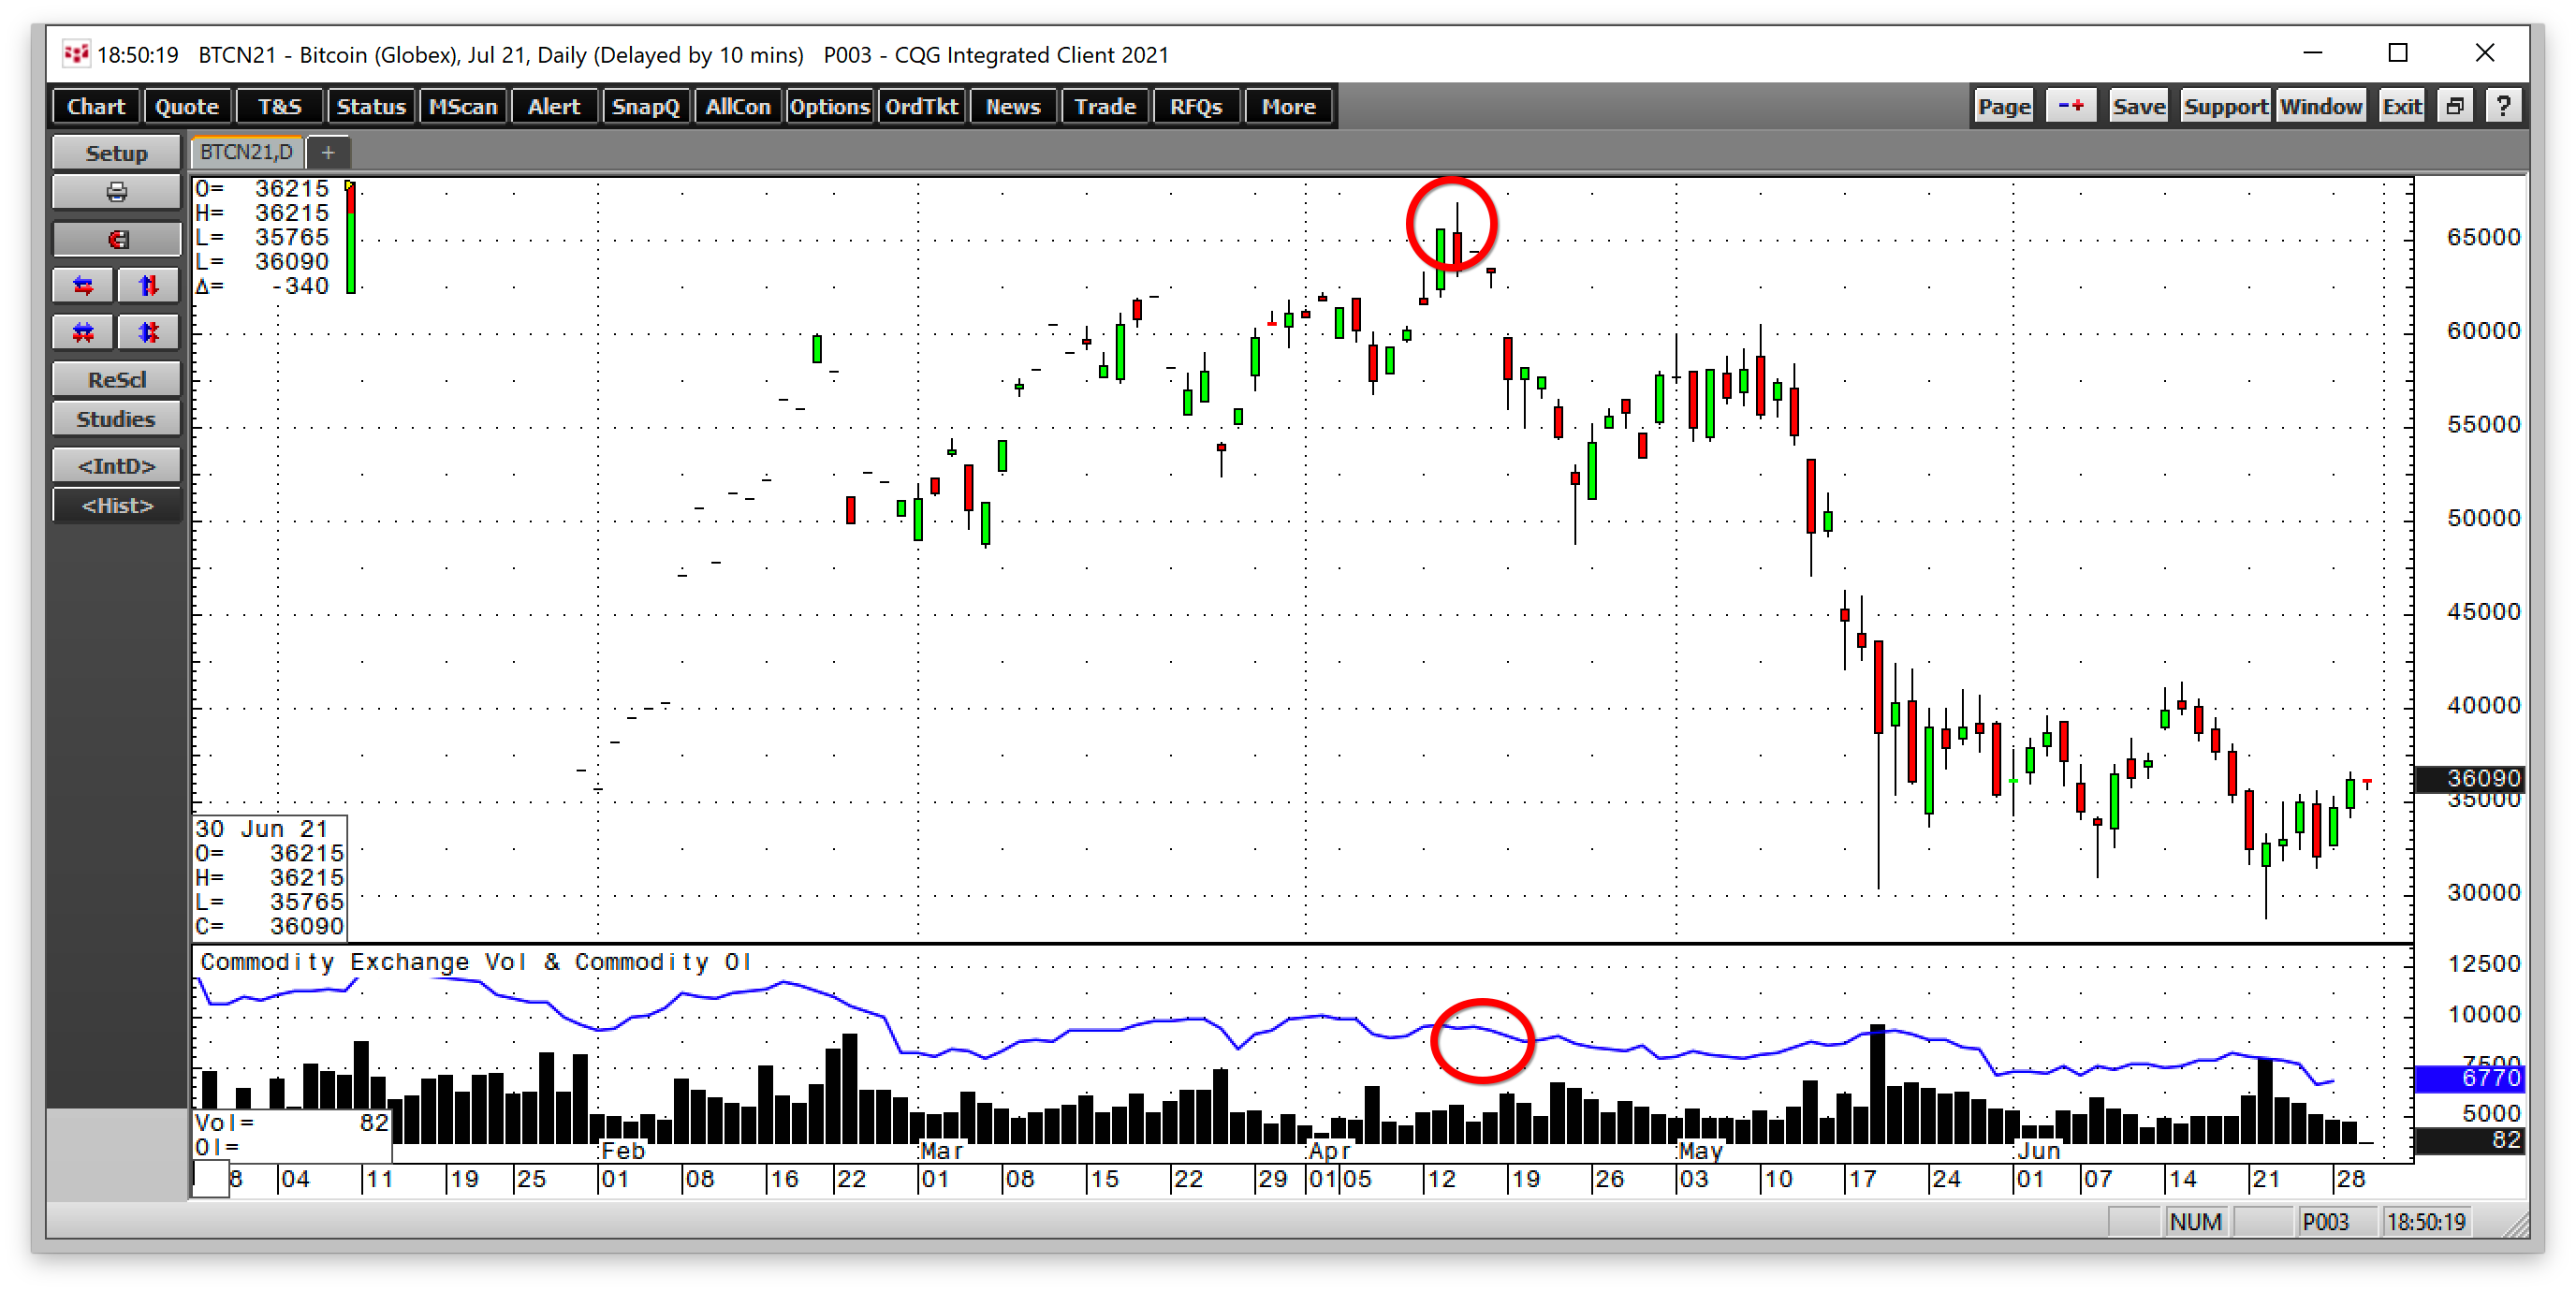
On Apr. 14, when Bitcoin reached its peak, open interest stood at 9,448 contracts. As of June 28, the metric was at the 6,770 level, over 28% lower. 
While the CME’s micro Bitcoin contract only began trading in early May, open interest dropped from a high of 37,790 contracts on May 24 to the 14,743 level on June 28, a decline of almost 61%.

Ethereum futures open interest declined from a high of 3,746 contracts on June 9 to 2,626 as of June 28 or nearly 30%.
The decline in open interest is a sign of long liquidation in the leading cryptocurrencies. Many investors and traders headed for an exit to risk positions as the prices corrected. Meanwhile, many of the other over 10,700 cryptos fell with the leaders. However, a growing addressable market continues to search for the next token that will provide Bitcoin or Ethereum-like returns.
The Graph and Hedera Hashgraph are in a group of tokens with higher market caps than over 99.5% of the other cryptos floating around in cyberspace.
The Graph: a top-tier crypto in 52nd place
The Graph is an indexing protocol for organizing blockchain data making it easily accessible with Graph QL. GRT’s website explains before The Graph, teams had to develop and operate proprietary indexing servers, requiring significant engineering and hardware resources, breaking the security properties necessary for decentralization. The Graph protocol solves these issues.
As the 52nd leading crypto on June 29, GRT had a market cap of $1.673 billion at 57.76 cents per token.

Source: CoinMarketCap
Since late 2020, GRT traded from a low of $0.1205 to a high of $2.7141. the high came in February 2021. Even though Bitcoin and Ethereum reached highs in April and May, GRT made lower highs and lower lows in a bearish trend since its February peak. GRT was around the 57.76 level on June 29.
Hedera Hashgraph just behind GRT
Hedera Hashgraph is a patented distributed ledger technology using acyclic graphs to create an asynchronous Byzantine Fault-Tolerant consensus algorithm. A Byzantine fault is a computer system condition where components may fail, and there is imperfect information if it failed.
HBAR uses an algorithm to correct the situation. The website states the protocol “ensures decentralized governance at scale.” HBAR is an energy-efficient cryptocurrency that powers the decentralized economy.
HBAR was trading at the 19.0 cents level on June 29 and was the 53rd leading cryptocurrency with a market cap of $1.670 billion at that time. 
Source: CoinMarketCap
Since trading began in September 2019, HBAR traded as low as just over one cent to a high of 40.89 cents per token in mid-April when Bitcoin reached its peak. At the 19 cents level, HBAR is trading near the middle of its trading range. The trend has been lower since the April high, following the crypto leaders.
A reminder of the risk
GRT and HBAR have the critical mass for traders and investors. Market caps of over $1.5 billion put the cryptos in the upper echelon of the asset class. While cryptos with robust market caps may be more likely to survive and offer traders a greater level of liquidity, the risk remains the same. Any investor or trader in the crypto asset class should only use the capital they are prepared to lose. A sudden ban on the asset class by governments, a computer hack, or many other factors could cause a total capital loss.
Risk is always a function of potential rewards. While some cryptos could offer exponential returns, most are likely to become worthless. Only dip a toe into the asset class with your eyes wide open about the potential risks.
Which stock should you buy in your very next trade?
With valuations skyrocketing in 2024, many investors are uneasy putting more money into stocks. Unsure where to invest next? Get access to our proven portfolios and discover high-potential opportunities.
In 2024 alone, ProPicks AI identified 2 stocks that surged over 150%, 4 additional stocks that leaped over 30%, and 3 more that climbed over 25%. That's an impressive track record.
With portfolios tailored for Dow stocks, S&P stocks, Tech stocks, and Mid Cap stocks, you can explore various wealth-building strategies.