
- Tech stocks held gains after Powell's press conference, but futures markets are mixed.
- The S&P 500 continues its record run, with key support levels to watch on any dips.
- With inflation concerns easing, the market's bullish trend shows no signs of stopping.
- Invest like the big funds for under $9/month with our AI-powered ProPicks stock selection tool. Learn more here>>
Big US technology stocks managed to hold onto their earlier sharp gains after Powell’s press conference last night, though S&P 500 Futures have since stalled while Dow Jones Futures have given back more gains after closing lower.
Technology is therefore continuing to do the heavy lifting; without it, the stock markets would look and feel a lot different. While the sector continues to trend positively, dip-buying in tech-heavy indices or ETFs like SPY or QQQ continues to make more sense than trying to pick the top from a trading point of view.
How AI Can Help Maximize Your Gains Amid Falling Inflation
The CPI print came in cooler than expected and it could present a golden opportunity to snag undervalued stocks poised for explosive growth. But how do you identify these hidden gems before everyone else?
Introducing ProPicks: Our cutting-edge AI analyzes mountains of data to pinpoint high-potential stocks before the market reacts.
Stop missing out! Subscribe to ProPicks today, and:
- Unearth hidden opportunities: Leverage AI to identify undervalued stocks with explosive growth potential.
- Stay ahead of the curve: Get a monthly list of AI-picked buys and sells before the market reacts.
- Gain an edge: Make informed investment decisions with powerful data and insights.
Now let’s take a look at the S&P 500 chart and technicals.
S&P 500 technical analysis and trade ideas
The S&P 500 Futures were little changed at the time of writing, after breaking and closing at a fresh record high on Wednesday.
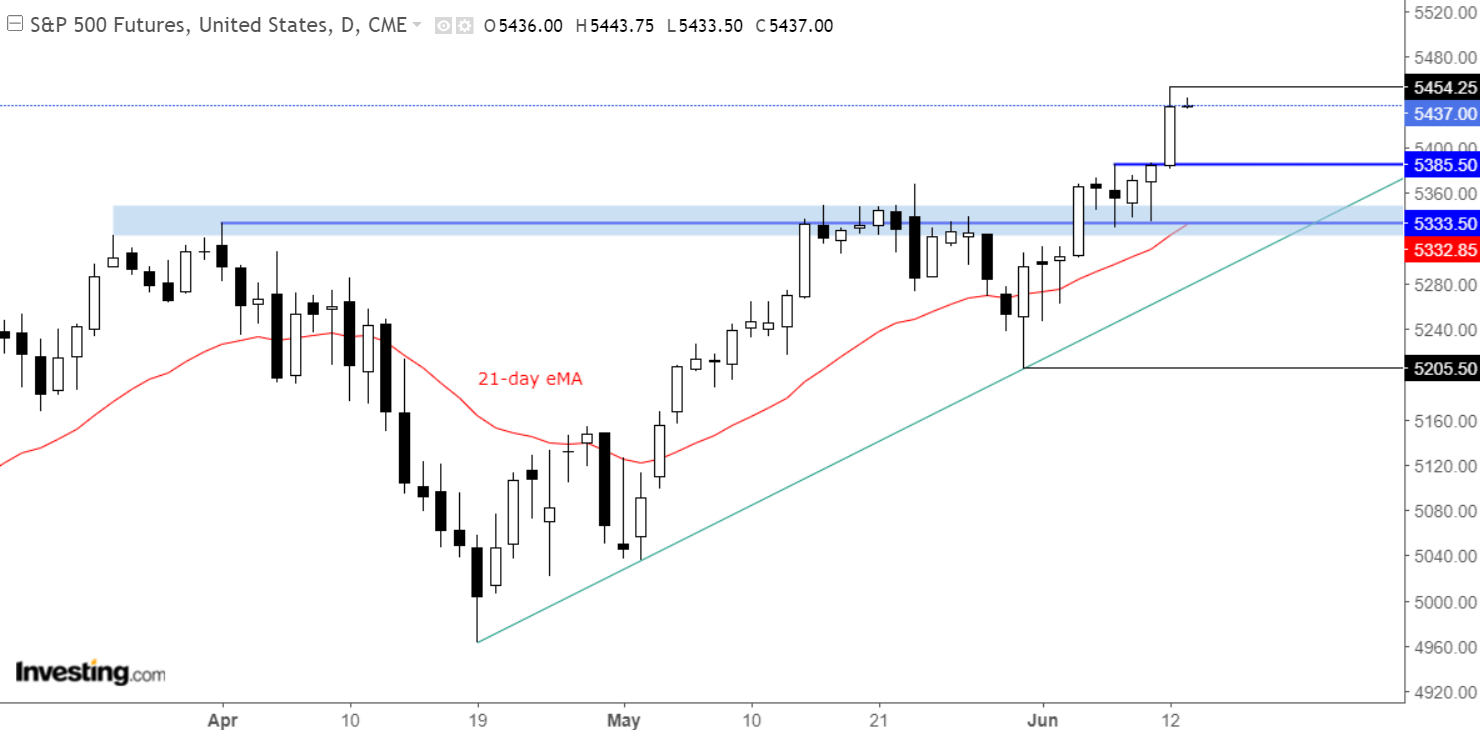
The breakout means the path of least resistance remains to the upside until the charts tell us otherwise. The base of Wednesday’s breakout at 5385 is now the most important short-term support level to watch on any potential dips. Support will need to hold there to maintain the short-term bullish bias intact.
Below this level, 5333 is the next important zone, where we also have the 21-day moving average converging. This level was previously a significant resistance level. Finally, 5205 is another level to watch, marking the most recent low formed a few weeks ago, before the latest rally. Should we move below this 5205 level at some point, then this would probably lead to a correction of some sort. It is therefore the line in the sand for me in so far as the short-term bullish trend is concerned.
The corresponding levels to watch on the SPY, an ETF which tracks the underlying S&P 500 index, are shown on the chart below:

As per the chart, the short-term support level is at 537, followed by 533 and 524. The most recent low and therefore the line in the sand is at 518.
The SPY chart, which unlike S&P 500 futures is only tradable during regular US market hours, shows a potential ‘evening star’ price candle on its chart, which is a potentially bearish sign. However, confirmation is needed before one can trade it short based on just the shape of this candle, given how strong the bullish trend has been and the fact that similar price patterns have only led to moderate downside follow-through if that.
S&P 500 keeps on marching on despite macro concerns
Indeed, we have now had well over 300 trading days since the S&P 500 has had a 2% down day, so the bears are nowhere to be seen. Until we start to see the breakout of such a streak and a lower low to confirm a potential bearish reversal, the bears will need to remain patient, even if the markets are starting to look quite overvalued.
The bullish trend needs to weaken first before it can break. This requires time. Indeed, this has been one of the longest rallies ever, with the S&P 500 posting no less than 27 new all-time highs already this year. I wouldn’t bet against more new highs given how crazy investors have been about AI and technology stocks.
Some would argue that the market wouldn't be so strong had it not been for so much deficit spending, which will need to be addressed at some point. Regardless, as traders, we have to respect the markets and not pre-empt anything without proper due diligence, even if the Fed is no longer expecting to cut rates three times this year.
Fed projects 1 rate cut as cost of living continues to rise
The Federal Reserve reduced their expectations for interest-rate cuts this year, though Chair Jerome Powell left the possibility open for more cuts, emphasizing that the new forecasts were conservative. Policymakers' updated economic projections indicated they expect to lower borrowing costs only once in 2024, down from the three reductions previously anticipated, according to their median estimate.
They also raised their inflation forecasts, despite positive consumer price data released earlier in the day. However, this cautious stance did little to deter bond traders, who continued to bet on rate cuts.
This is even though at 3.4%, CPI inflation remains well above the Fed’s target, holding above 3% for the 38th consecutive month, with super core CPI, which includes core services inflation less shelter, increasing 5% year-over-year in May to its highest level since April last year.
This is making the cost of living extremely expensive, especially when you consider that median US house prices remain at an all-time high of $434,000 and GDP growth slowing to 1.3% in the first quarter. Worryingly, there are no plans in place to address the near $35-trillion national debt and rising deficits.
***
Be sure to check out InvestingPro to stay in sync with the market trend and what it means for your trading. As with any investment, it's crucial to research extensively before making any decisions.
InvestingPro empowers investors to make informed decisions by providing a comprehensive analysis of undervalued stocks with the potential for significant upside in the market.
Subscribe here for under $9/month and never miss a bull market again!

Disclaimer: This article is written for informational purposes only; it does not constitute a solicitation, offer, advice, or recommendation to invest as such it is not intended to incentivize the purchase of assets in any way. I would like to remind you that any type of asset, is evaluated from multiple points of view and is highly risky and therefore, any investment decision and the associated risk remains with the investor.