TotalEnergies to become largest shareholder in U.K. oil and gas venture
- This article delves into five distinct indicators that can offer valuable insights into potential shifts in direction or sentiment.
- Relative Strength emerges as a powerful tool, illuminating performance trends and aiding investors in discerning market dynamics.
- The comparison of various asset classes can help investors stay ahead of evolving market trends
- Looking to beat the market in 2024? Let our AI-powered ProPicks do the leg work for you, and never miss another bull market again. Learn More »
While predicting the market's next move is impossible, certain indicators can assist in identifying signs of a potential shift in direction or sentiment.
This article delves into five such indicators you can keep an eye on to stay ahead of a possible change in market direction.
One of my favorite tools that I often use is Relative Strength.
In simpler terms, a bullish trend signifies that the asset at the numerator outperforms the one at the denominator.
Conversely, a bearish trend indicates the opposite. When the trend moves sideways, signaling no clear direction, both assets experience equal percentage increases and decreases.
Often, the most effective solutions are the simplest. Now, Here are the five simple indicators that can help you spot a trend change:
1. Stocks Vs. Bonds
From the VTI vs. AGG chart, we can see that the trend continues to be in favor of equities, after the lows in 2020 and lateralization in 2022, with the ratio recently performing positively and making a new all-time high.
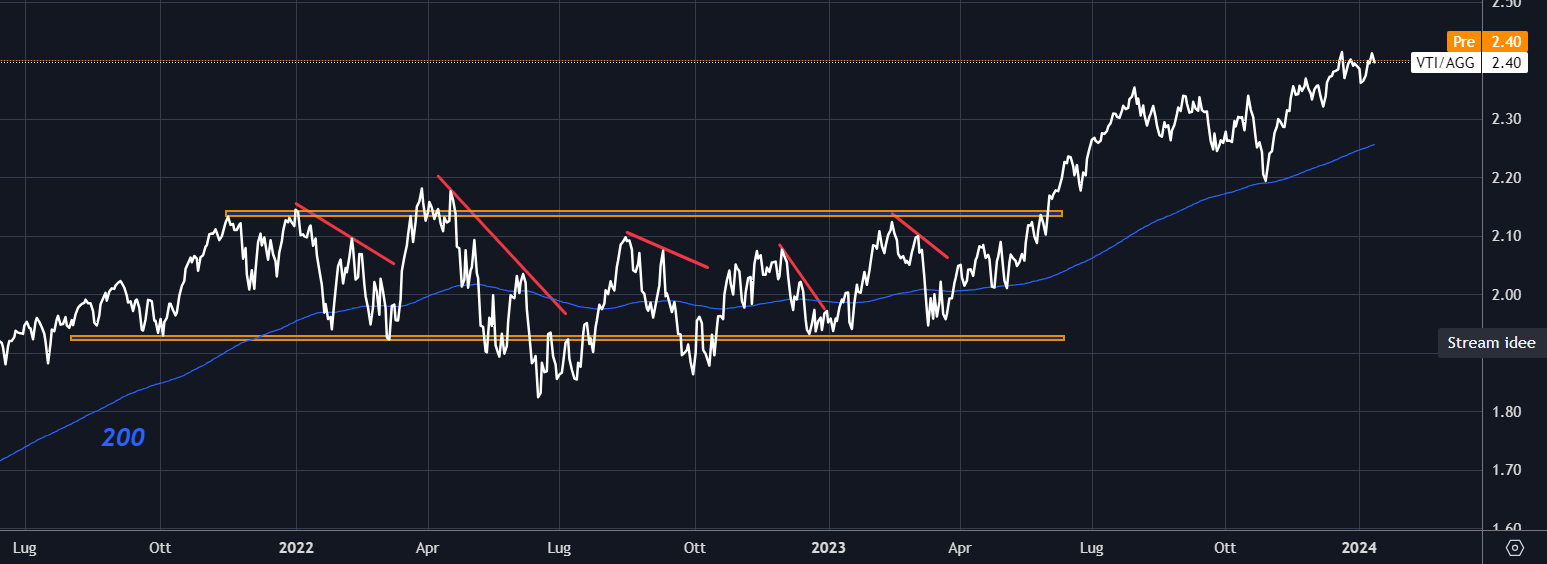
2. Nasdaq Vs. Treasury Bonds
Moreover, in bullish markets, the best stocks not only perform well in absolute terms but also outperform their 'alternatives'. And US Treasuries are the alternative to equities. QQQ vs. IEF:
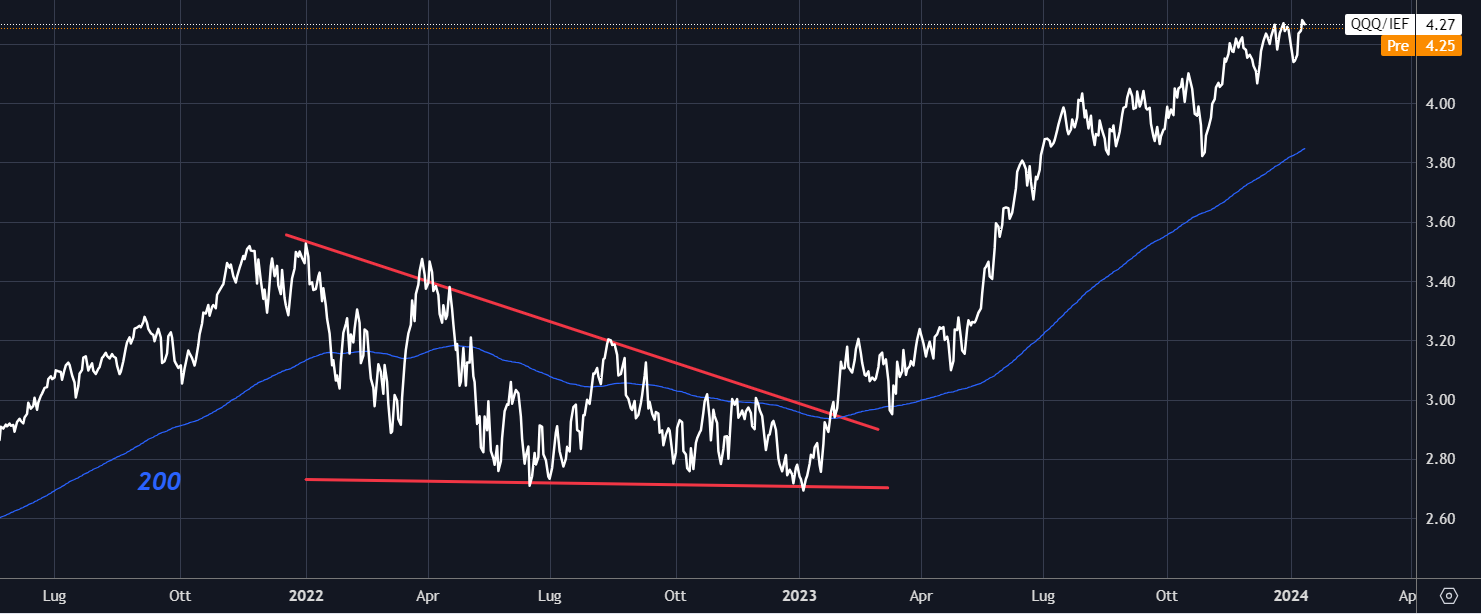
After a bearish 2022 trend in favor of Treasuries, the Nasdaq outperformed sharply in 2023 and recorded new all-time highs.
3. Equities Vs. Commodities
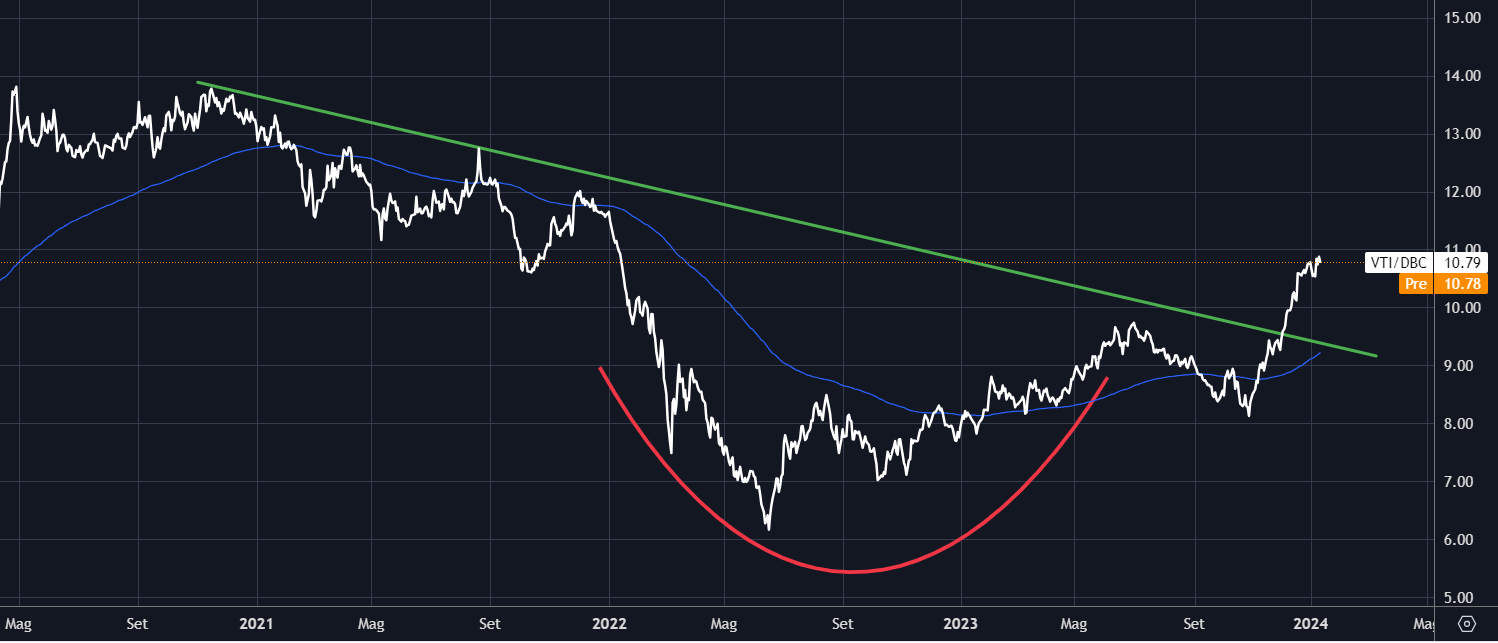
During 2023, as we see from the VTI vs. DBC chart, again the trend went in favor of equities, with the ratio recovering 2-year highs.
4. Nasdaq Vs. Gold
Specifically, the Nasdaq relative to Gold is trending bullish, although it has not yet recorded new all-time highs some 10 percent away. QQQ Vs. GLD: 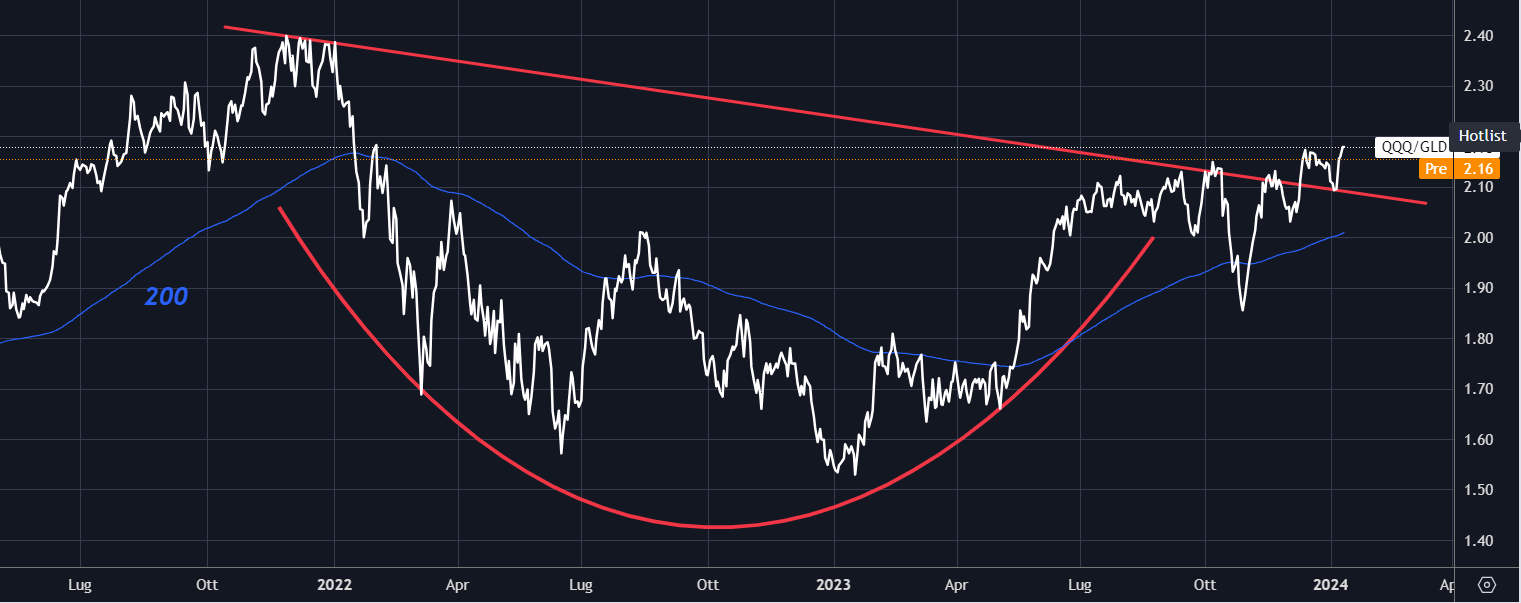
5. Large Vs. Small Cap Stocks
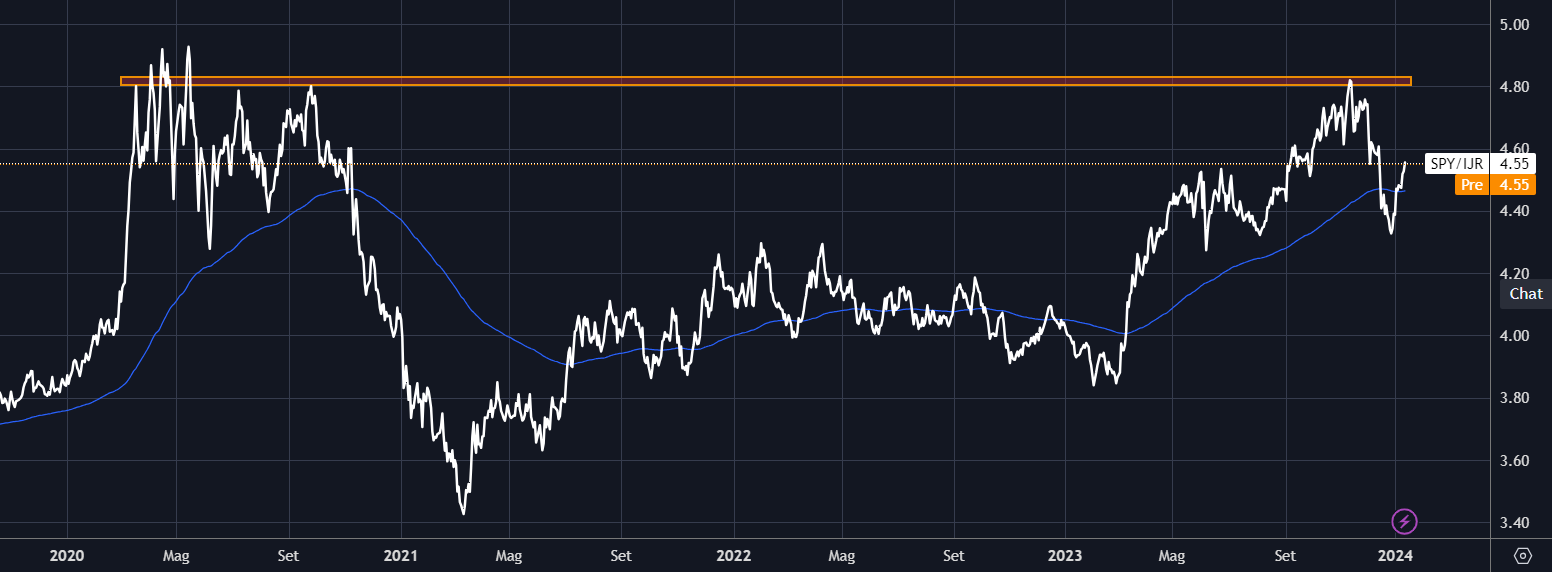
The trend has changed since the March 2021 lows, an impressive move accelerated during 2023 by large-cap stocks.
Currently, previous all-time highs are acting as resistance, the trend remains in favor of Big Caps but could it change in favor of small caps?
Investors often try to fight trends, could this be one of those situations?
***
In 2024, let hard decisions become easy with our AI-powered stock-picking tool.
Have you ever found yourself faced with the question: which stock should I buy next?
Luckily, this feeling is long gone for ProPicks users. Using state-of-the-art AI technology, ProPicks provides six market-beating stock-picking strategies, including the flagship "Tech Titans," which outperformed the market by 670% over the last decade.
Disclaimer: This article is written for informational purposes only; it does not constitute a solicitation, offer, advice, or recommendation to invest as such it is not intended to incentivize the purchase of assets in any way. I would like to remind you that any type of asset, is evaluated from multiple perspectives and is highly risky and therefore, any investment decision and the associated risk remains with the investor.

