This post was written exclusively for Investing.com
The flight to safety recently witnessed through plunging bond yields and positioning into safe-haven assets may be ending. Investors had been rushing into safe-haven assets as geopolitical tensions increased throughout the hot summer month of August. Now, as the fall approaches and temperatures cool, so do some of the tensions, which appear to be putting investors back into a risk-taking mood.
The (Volatility Index) has been breaking down in recent days and is now on the cusp of falling even further, as equity markets around the globe break out from their summer doldrums. The shift in mood is due to the de-escalation in the U.S./China trade war, the move by Hong Kong to remove the bill for extradition to mainland China, and the lowered odds of a no-deal Brexit. Suddenly the dense fog of gloom and doom of last month appears to be lifting.
A Volatile August
The month of August was brutal for the markets, with equity prices whipsawing in a roughly 4% range on the S&P 500. The equity market volatility sent yields plunging, as staples, utilities, and gold soared. From July 31 through Sept. 4 the Select Sector SPDR Consumer Staples ETF (NYSE:XLP) increased by almost 4%, the Select Sector SPDR Utilities ETF (NYSE:XLU) gained over 7%, as SPDR Gold Shares (NYSE:GLD) increased by more than 9%. That was better than the S&P 500 decline of over 1%.
Fears Ease
Now the risk aversion trade may be unwinding. The VIX, for example, had been trading in a range of 16 to 21 throughout August. But as of September 5, that measure of volatility is testing support at 16, and could be heading lower as fears continues to ease.
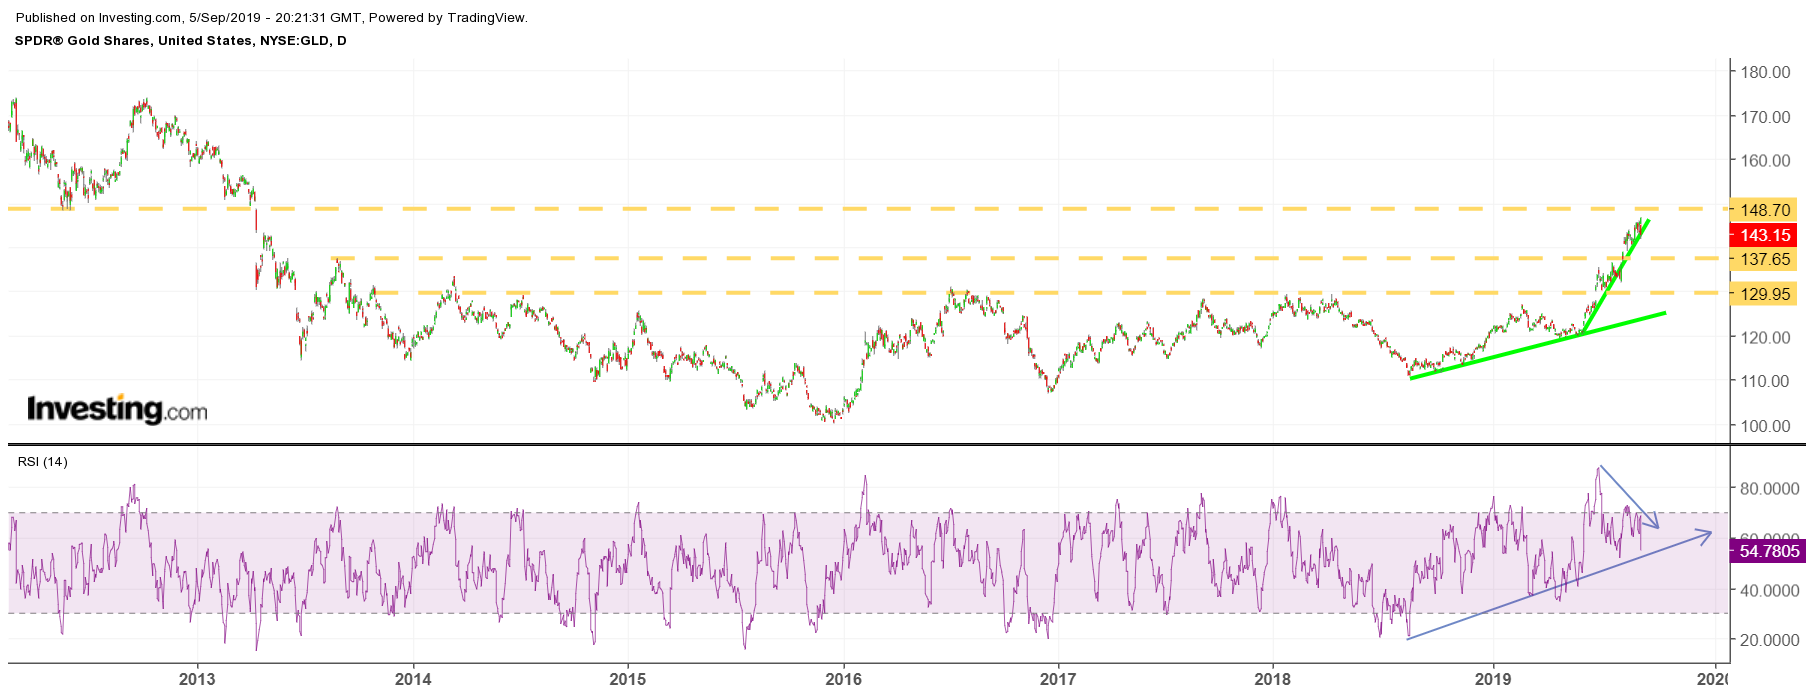
Additionally, the gold ETF has been rising as fears have been mounting too. But now GLD (NYSE:GLD) is bumping up against a level of strong resistance at a price of around $149. Also, the pattern in the chart is known as a bump and run, a bearish reversal pattern, an indication that gold is due to fall. Meanwhile, the relative strength index (RSI) is also flashing warning signs as it has been trending lower, despite the price of gold trending higher, a bearish divergence. Should gold fall below the uptrend at a price of approximately $143. It could drop back to support at a price of around $136.50, a decline of about 5%.

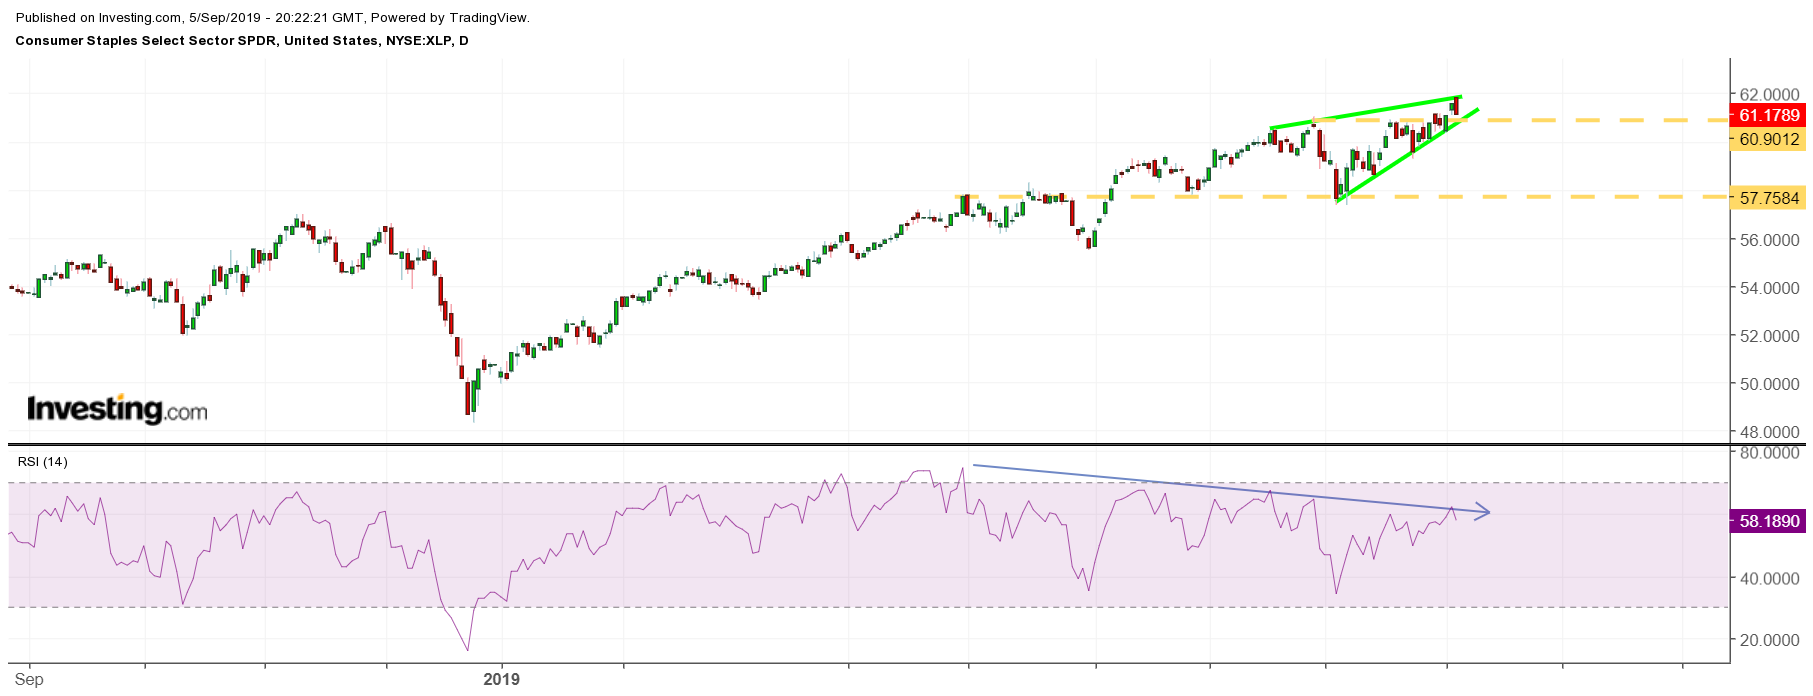
The Staples ETF is also flashing some of those same warning signs. The technical chart shows the price rising in recent weeks but is forming a bearish technical pattern known as a rising wedge. Additionally, the RSI for the ETF is exhibiting a bearish divergence as it trends lower, despite the ETF reaching higher prices. Should the ETF decline below $60.90 it could weaken to around $57.75 a drop of 6% from its price of approximately $61.20.

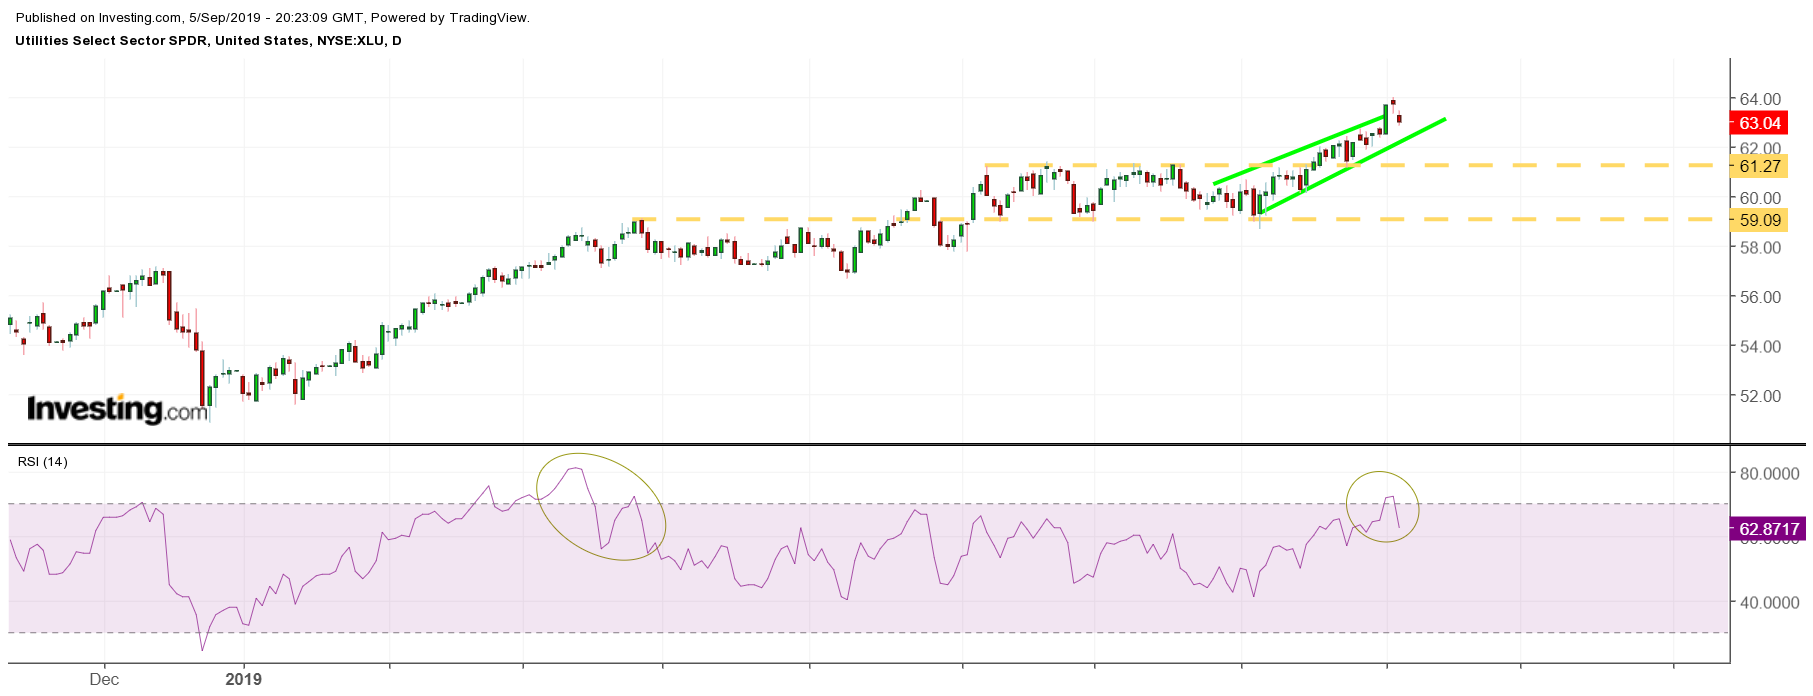
The Utility ETF is also suggesting a pullback may be on the way. The RSI has risen above 70, and that would indicate the sector is overbought. The last time that happened was in March, and the ETF went on to trade sideways for the next two months.

Risk Back?
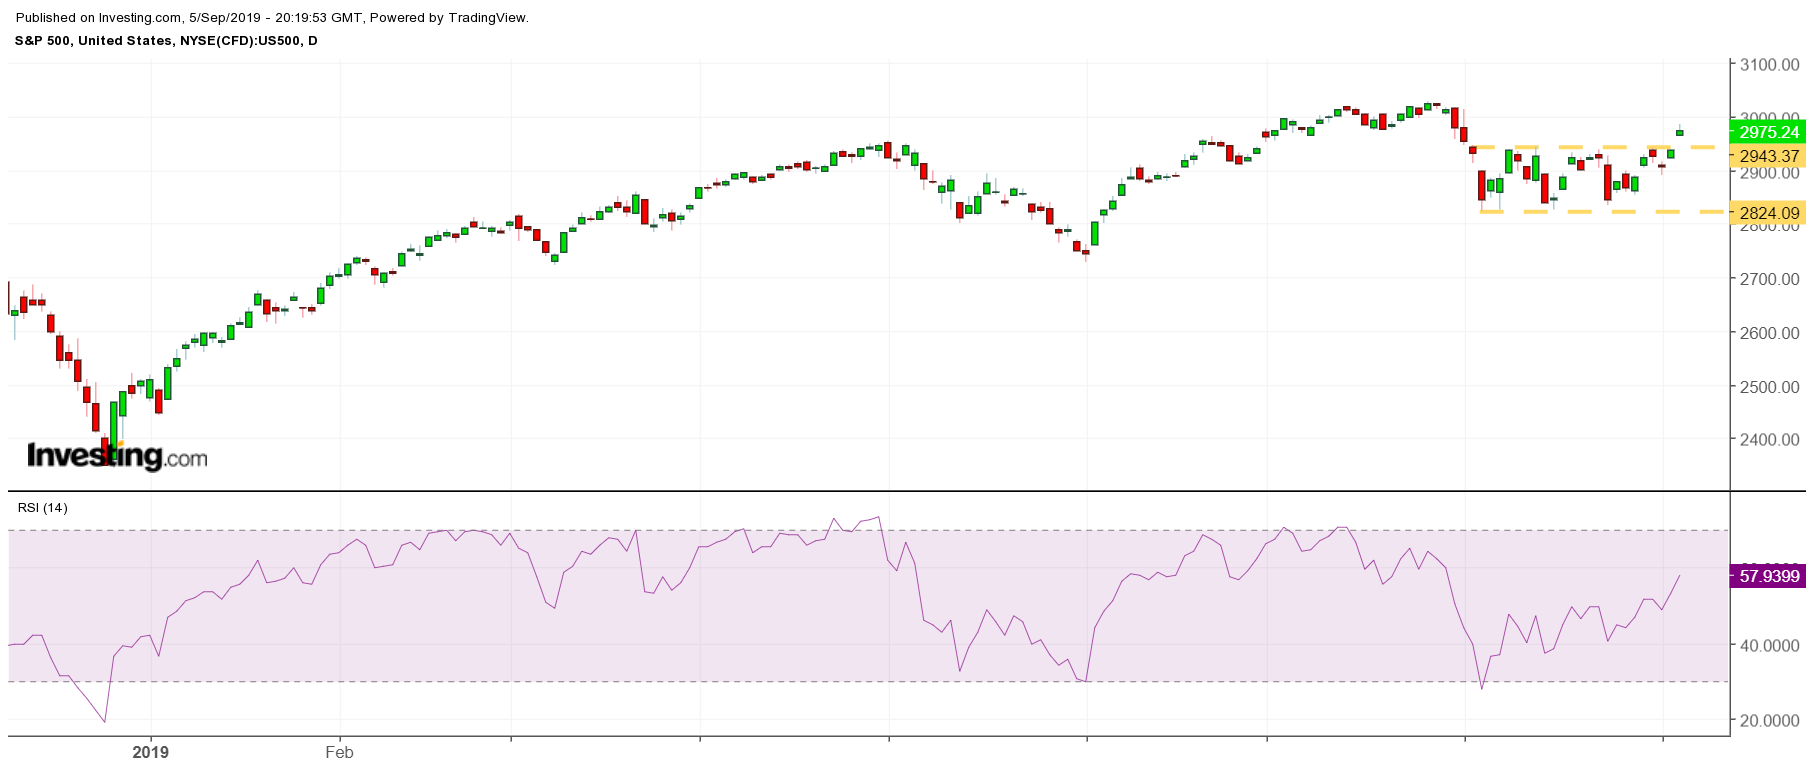
But the big sign of the risk aversion trade fading is the S&P 500 which finally broke above its August resistance level at 2,935 and surged to as high as 2985 on September 5, as investors begin rotating back into risky sectors.

Should the geopolitical fears that weighed on markets in August continue to ease, it seems likely that the risk aversion trade will only continue to unwind. That means that stocks may be poised to reach their all-time highs once again.
