The price of oil is falling for the sixth straight day, the longest streak since September.
The fact that oil failed to garner demand even in the face of potentially the biggest disruption to production in years amid the U.S.-Iran military face-off requires investigation.
Investors appear determined to accept interpretations that suggest U.S. and Iran are retreating from military escalation. However, investors are human and tend to be biased: another example was their acceptance of repeated positive rhetoric amid the U.S.-China on-again-off-again trade negotiations when they were happy to dive into the growing supply of cheap cash provided by the Fed.
But dwindling asks project a dismal outlook for demand, according to expectations from China's state-controlled National Petroleum Corporation, the nation's largest oil company. The energy giant sees total inventories — domestic production + imports — growing by 2.4% for the year, less than half the growth by percentage in 2019. If this scenario plays out, it would be the slowest growth since the 2008 crash.
While, prices rebounded as the relationship between the U.S. and China improved in terms of a trade agreement, CNPC doesn’t expect any changes in the short term.
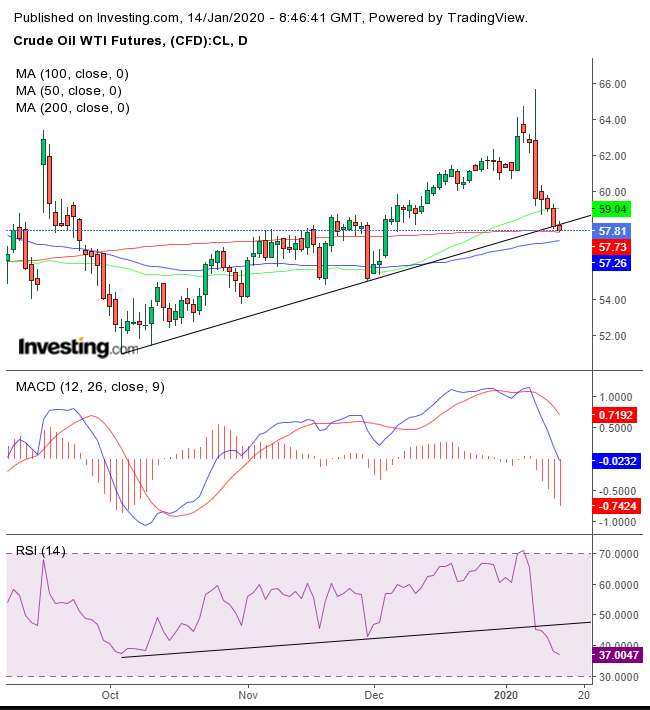
The chart below illustrates how these drivers are playing out:

The $60 psychological round number failed to support WTI, even after tensions between the U.S. and Iran escalated to the highest in years, bringing the two countries to the brink of war. Moreover, the price just dipped below its uptrend line since the Oct. 3 low of $50.99, always the first sign of a potential trend reversal.
Investors might expect the uptrend to hold after the 50 DMA crossed above the 200 DMA in late December, triggering a golden cross. However, for a moving average to be significant, the price must move and the price has been trendless since January 2018. This golden cross is the second since May. The price however, is still above the 200 DMA.
Meanwhile, the MACD and the RSI provided sell signals.
Trading Strategies
Conservative traders would wait for oil to break free of its $51-$66 range, for fear of being whipsawed.
Moderate traders may short if the price closes below $56.50, employing a minimum 3% filter (more than our general 2% for moderate risk, considering the less reliable trendsetting within a congestion). Then, they'd wait for a return move, for a better entry price, if not for confirmation of resistance.
Aggressive traders may short upon a close below the 200 DMA, just 3 cents below the current price of $57.77. The longer and deeper the filter below, the more reliable the downside breakout.
Trade Sample
- Entry: $58, after the price has first closed below $57 and rebounded on profit-taking
- Stop-Loss: $59
- Risk: $1
- Target: $55
- Reward: $3
- Risk:Reward Ratio: 1:3
