- Bitcoin shows signs of recovery after a sharp drop, forming a potentially bullish ascending triangle pattern.
- Despite resistance at $61,000, price action at higher levels suggests the possibility of a breakout.
- The upcoming speech by Jerome Powell at Jackson Hole could have a say in what happens next.
- For less than $8 a month, InvestingPro's Fair Value tool helps you find which stocks to hold and which to dump at the click of a button.
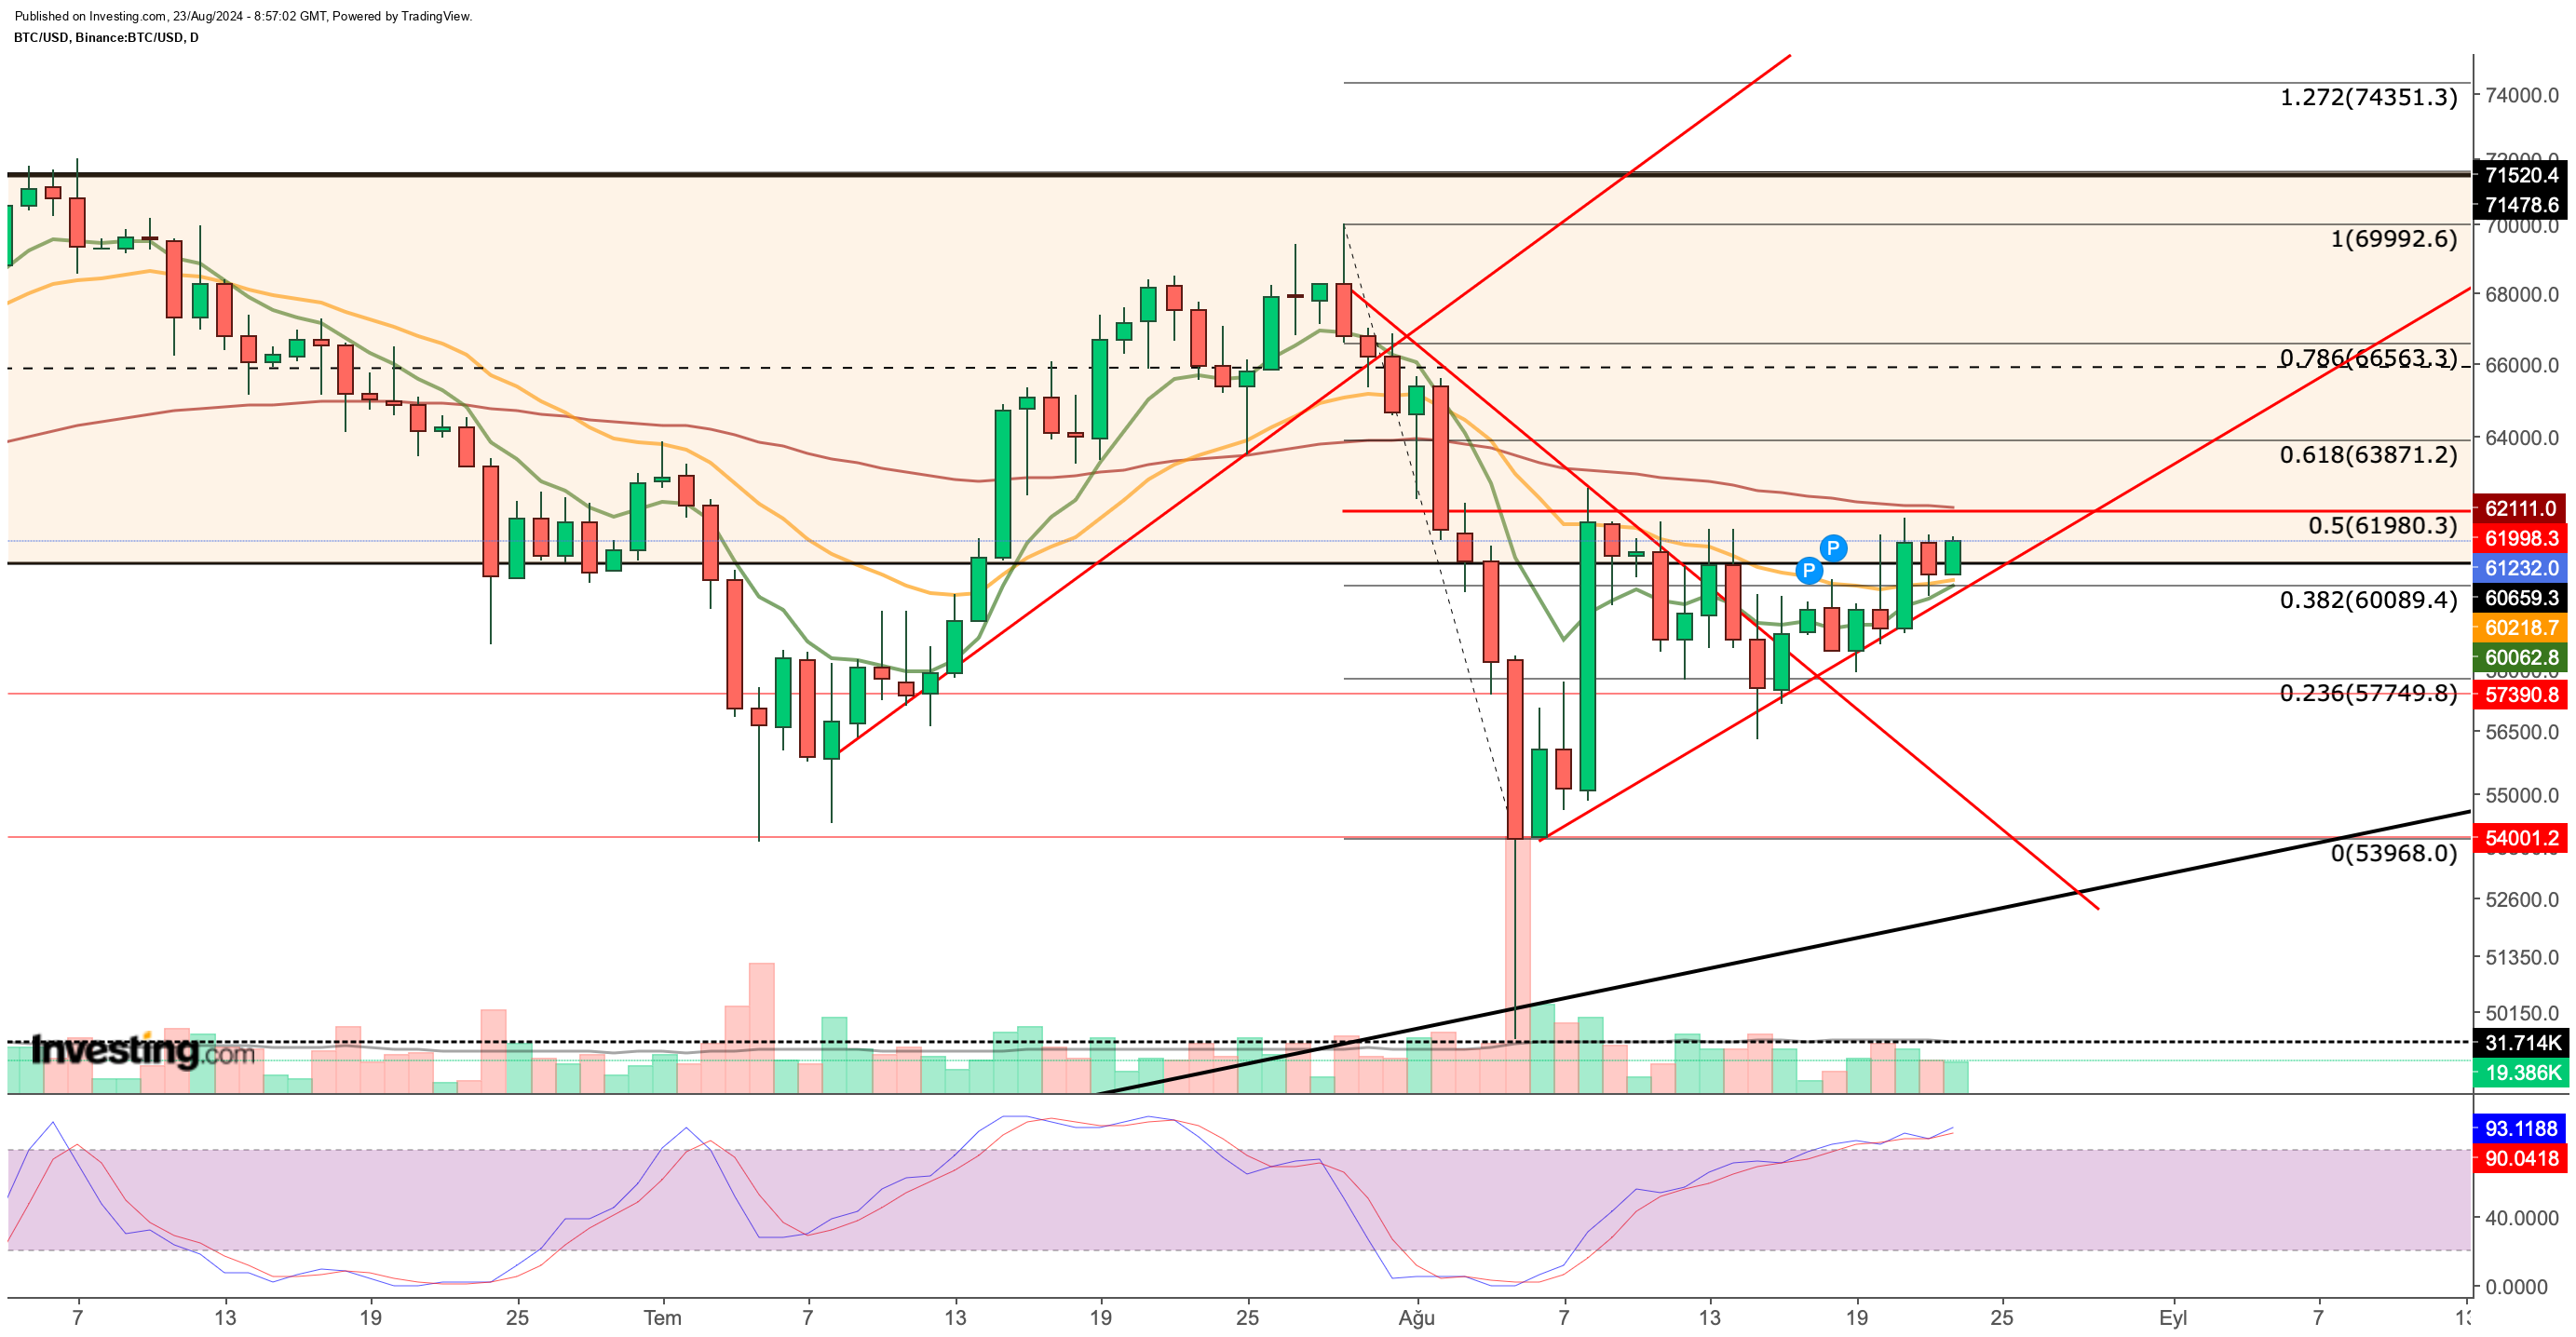
Bitcoin is partially recovering after a sharp drop earlier this month. Despite being repeatedly rejected from the $61,000 region, the cryptocurrency has been forming lower lows, and the latest analysis shows an ascending triangle pattern on the charts—typically a bullish signal.
In early August, global markets were hit by panic selling due to recession fears in the US and an interest rate hike by the Bank of Japan, which also dragged down the crypto market. However, as recession concerns quickly faded and it became clear that Japan would move more slowly with rate hikes, traditional markets bounced back.
Unfortunately, the same can't be said for the cryptocurrency markets, where recovery has been limited. Although Bitcoin recovered about half of its losses, the $61,000 region remains a formidable resistance point. This is a crucial barrier, but the fact that buyers are stepping in at higher levels suggests that the recovery could gain momentum as the pressure eases.
The ascending triangle pattern that Bitcoin has formed on its daily chart is generally seen as a bullish setup. When the price meets resistance at a clear level and still attracts buyers at higher levels, it’s often a sign that a breakout could be imminent.
Zooming in on Bitcoin, the upper line of the triangle aligns with the $61,000 region. Selling pressure here seems to be influenced by the US government's policies and Mt. Gox repayments, which are tempering market optimism. Yet, the broader market environment is still favorable for a potential rise.
In the meantime, the market is also focused on the Federal Reserve's monetary policy. A dovish tone from Fed Chairman Jerome Powell at the Jackson Hole Symposium could boost demand for Bitcoin and help it break through the $61,000 resistance level.
Bitcoin: Technical View
On the daily chart, the 3-month EMA stands at $61,980, and a move above this level could trigger an acceleration in the bullish trend. Earlier this month, the decline intensified when Bitcoin broke below the 3-month exponential moving average with high volume.

In a bullish scenario, if Bitcoin pushes above the $62,000 mark, we could see a swift rise to $63,800, followed by a potential retest of the EMA value at $62,000.
Successfully passing this retest could propel Bitcoin toward the previous resistance area in the $70,000-$73,000 region. Regaining the $62,000 level would also create a positive crossover of the EMA values, adding another bullish signal from these indicators.
In a bearish scenario, if Bitcoin fails to reach $62,000, the $60,000 level—where the ascending line of the triangle and short-term EMA values converge—will become critical. The daily chart shows Bitcoin’s price squeezing closer to the intersection of the triangle, signaling that volatility might increase in the coming days.
If selling pressure returns and Bitcoin drops below $60,000, the risk of a new wave of selling will rise. A potential breakout could push BTC down to the $57,700 level, and possibly further to the $53,000 region.
A hawkish statement from Powell, though currently considered unlikely, could be the catalyst for this negative outcome. In summary, Bitcoin may soon make a decisive move toward either the $60,000-$62,000 range or further downside, depending on how these key levels play out.
Critical Levels to Watch for Ethereum
Ethereum has shown more stability than Bitcoin after its sharp decline and partial recovery.
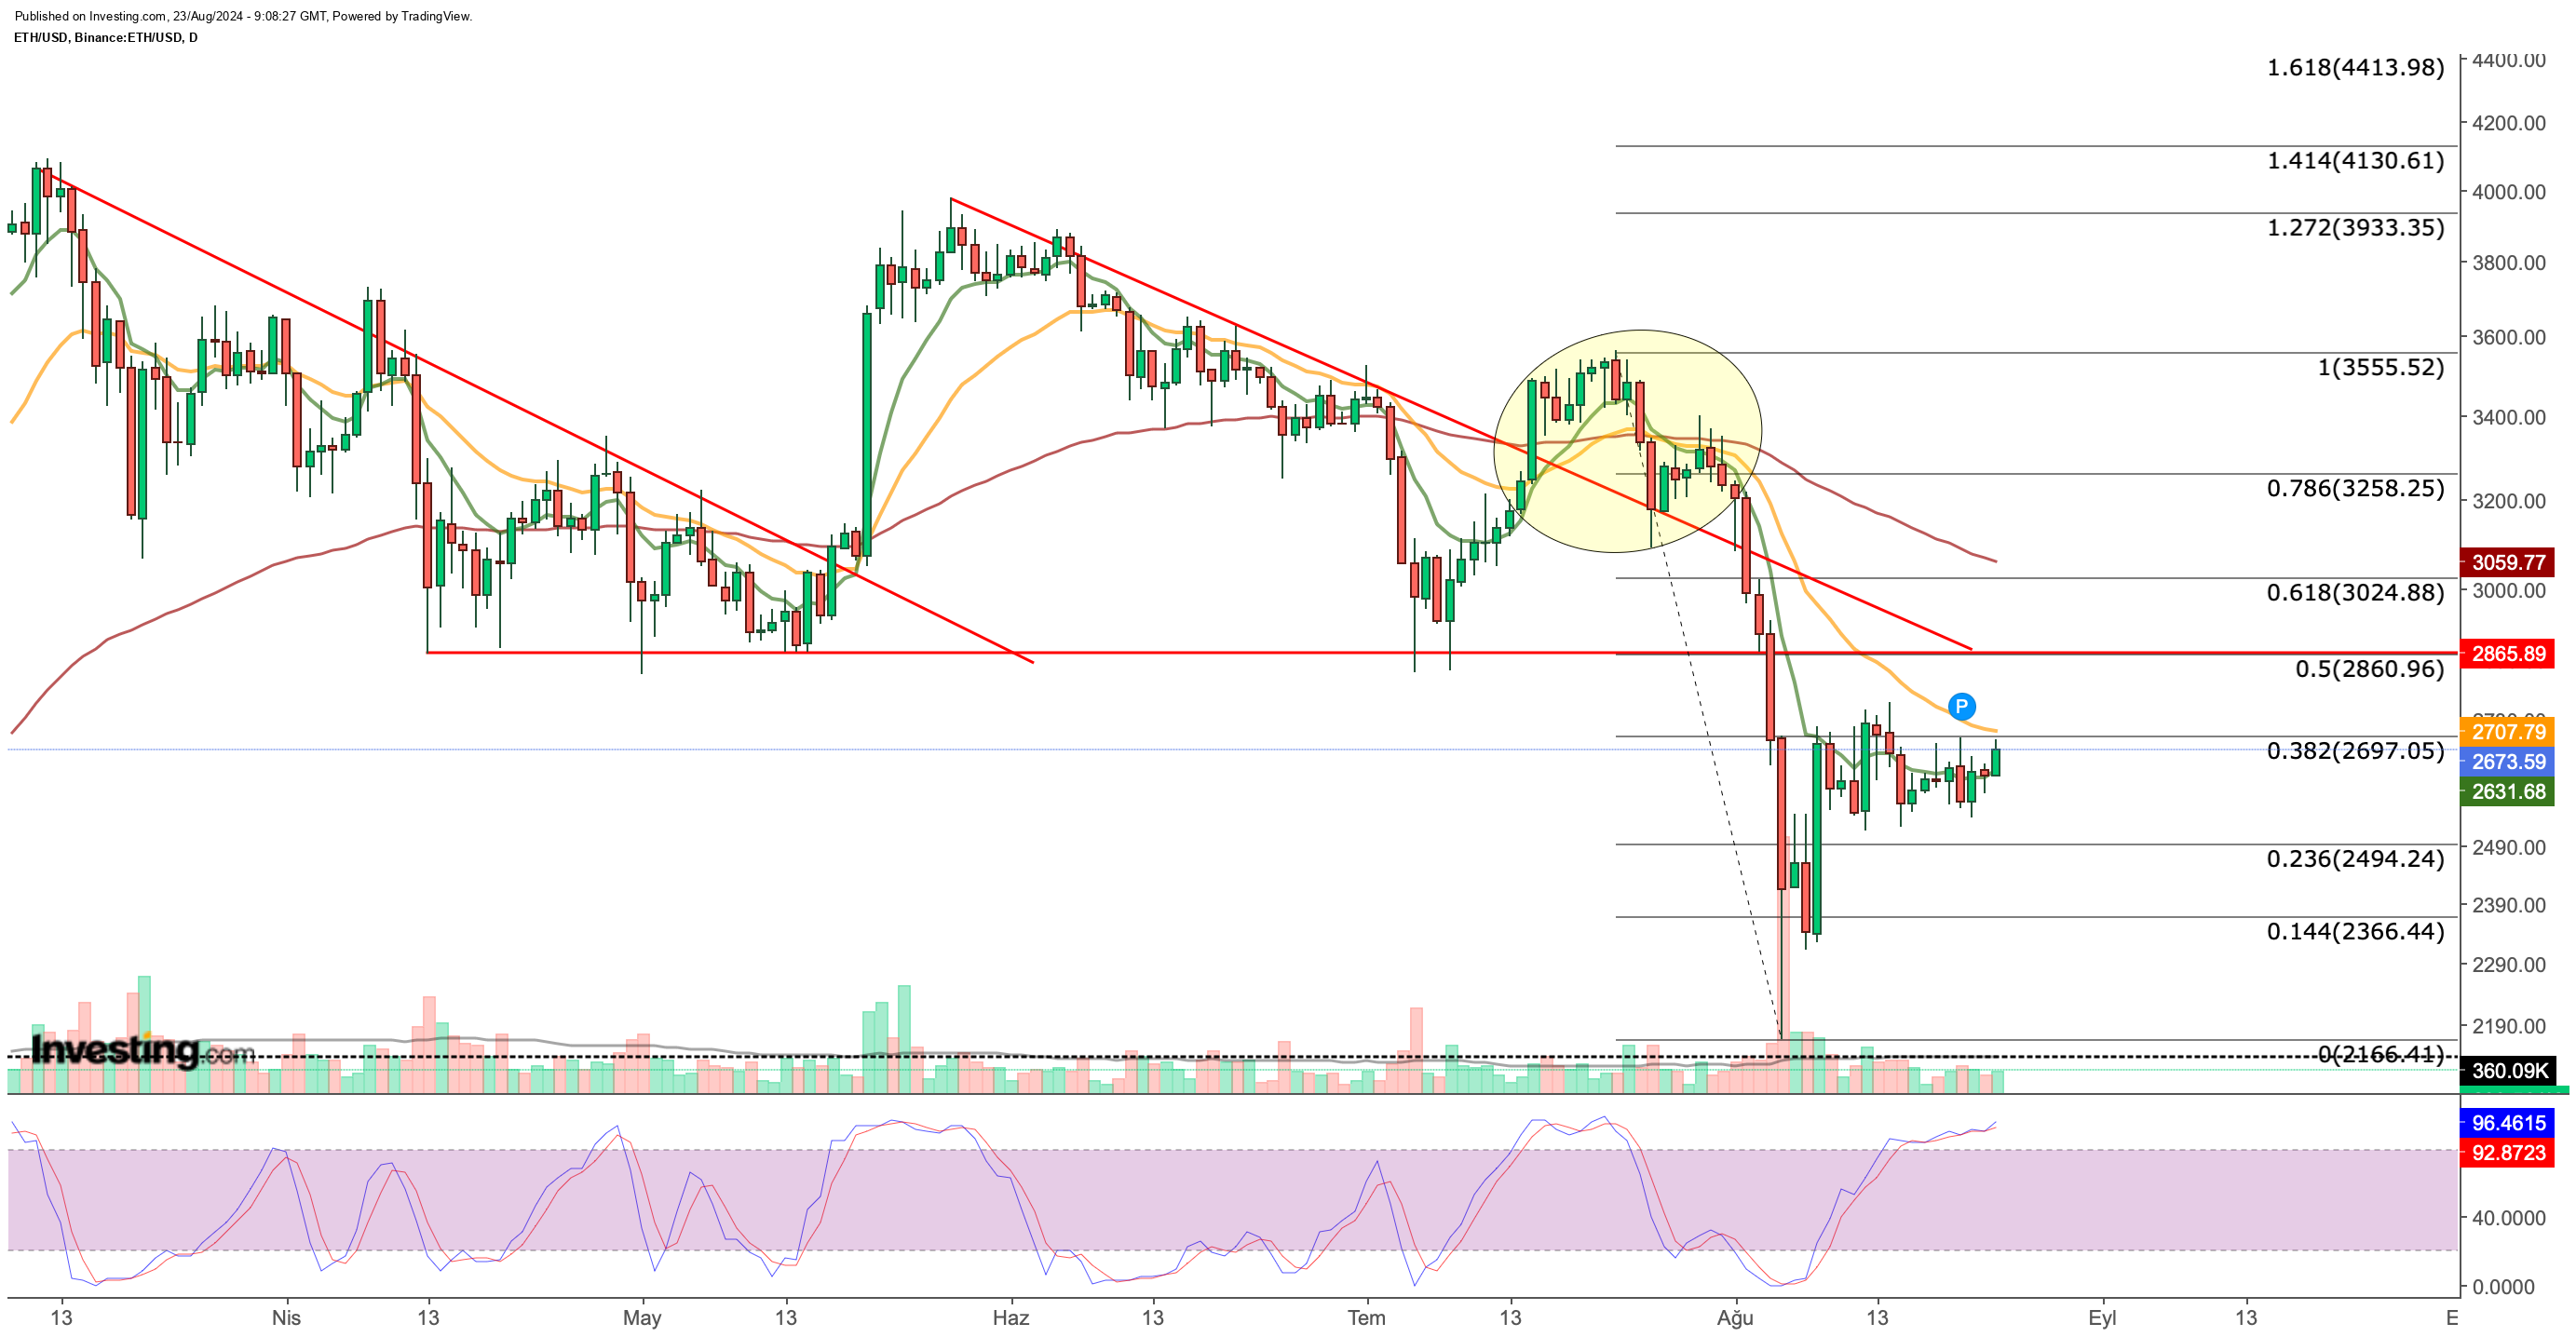
In August, Ethereum faced resistance around the $2,700 level, with selling pressure consistently meeting support near $2,550. A sustained move above the $2,700 mark, with solid daily closures in this range, could kickstart an upward trend.
However, the low trading volume in the Ethereum market, where buyer interest remains limited, leaves the cryptocurrency vulnerable to potential selling pressure.

If Ethereum loses its support around $2,500, selling could accelerate, potentially pushing the price down to the $2,000-$2,100 range.
On the flip side, if ETH manages to reach $2,700 in a bullish move, this would be seen as the first step in a broader rally. For the upward trend to solidify, establishing a firm base around the $2,900 level will be crucial.
***
Disclaimer: This article is written for informational purposes only. It is not intended to encourage the purchase of assets in any way, nor does it constitute a solicitation, offer, recommendation or suggestion to invest. I would like to remind you that all assets are evaluated from multiple perspectives and are highly risky, so any investment decision and the associated risk is at the investor's own risk. We also do not provide any investment advisory services. We will never contact you to offer investment or advisory services.
