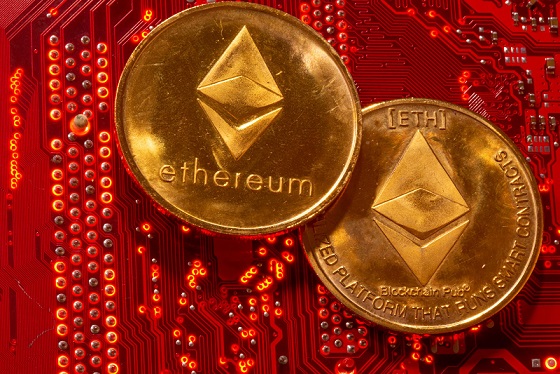
U.Today - Ethereum is kind of losing it. It is likely that you have already seen the recent price action near the $4,000 mark. Unfortunately, Ether has failed to move past this mark or even reach it and gain a foothold there.
Ethereum has been trading in a narrowing range. Usually, this pattern indicates a phase of consolidation preceding a possible breakout. Here, the important levels to keep an eye on are roughly $3,900 on the upper side and $3,626 on the lower side.
It has been tested a few times recently, and the immediate support is currently at $3,626. Conversely, any bullish continuation would require a strong breach of the resistance leveled at $3,900.
Another important factor is volume. A lack of strong buying pressure may be the reason for the lower trading volumes we have seen recently. Since ETH is neither overbought nor oversold and has room to move in either direction, the Relative Strength Index (RSI) is circling 65.88.
A further drop toward the 50-day moving average, which is currently at $3,298, may occur if Ethereum breaches the $3,626 support level. But ETH might return to the $4,000 region and higher if it breaks above the $3,900 barrier.
Solana pushes to new heights
Solana has indeed climbed toward the $170 threshold and might be actively conquering it in the foreseeable future.Solana has been moving within a narrow range on the daily chart. The green line indicates the $165.84 support area, where the price appears to be holding steady after reversing below $170. The blue line at $156.52 and the orange line at $151.66 are important support levels to keep an eye on. Historically, these levels have provided a lot of support.
The levels of immediate support are $156.52 and $165.84. Should these levels hold, SOL may try to make another push for $170.
The important resistance level is still $170. If SOL breaks above this, it might rise higher.
If Solana is able to sustain support above $165.84, another attempt to break $170 may occur. Nevertheless, a decline toward $150 or less may be indicated if it closes below $156.52, which would signal a bearish trend.
Long-awaited XRP stability
Lately, XRP has been remarkably stable, consistently trading at or near $0.52. Let’s examine the chart to see what is causing this stability and what to look out for going forward.XRP has been in a consolidation phase on the daily chart. The $0.50 support level, indicated by the green line, has been maintained by the market. Approximately $0.55 (orange line) and $0.57 (black line) are the resistance levels to be aware of.
Approximately $0.50 is the closest support. Strong buying interest is indicated if XRP remains above this level. The $0.55 and $0.57 levels are important resistance points. If these levels are broken, a bullish trend might be indicated.
Moving averages offer more information. Acting as support, the 50-day moving average is situated below the current price. The 200-day (black line) and 100-day (orange line) moving averages are both above the current price level, offering solid resistance levels for the future.
As always, volume is important. Consistent trading volumes in recent times indicate steady interest. With XRP’s Relative Strength Index (RSI) at 51.89, it is clear that the asset is neither overbought nor over sold, which does not offer much insight but shows that things are relatively steady.
The $0.55 resistance level may be broken by XRP if it maintains its hold above the $0.50 support level. If the break is successful, XRP may move up to $0.57 and higher. But if it drops below $0.50, that could indicate a bearish trend.
