By Barani Krishnan
Investing.com - Already up 20% this year, the rally in gold is still going, fed by fears over the trade war and the potential for the world to plunge into a recession.
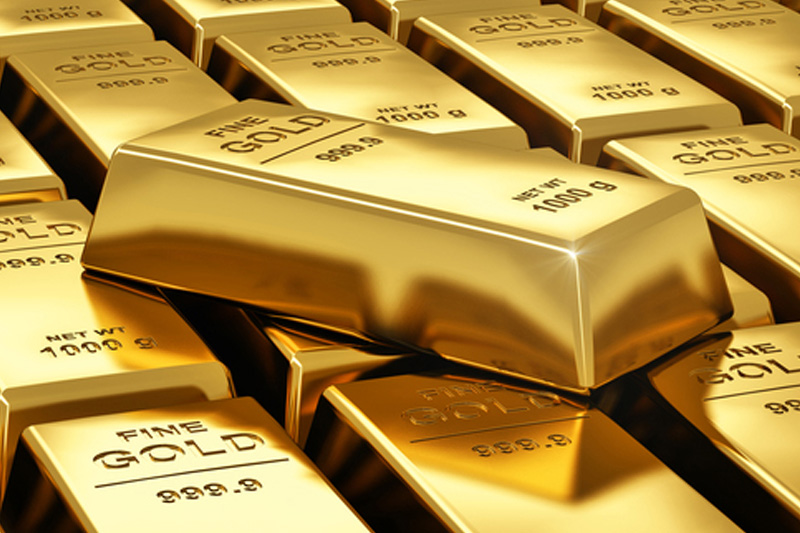
Spot gold, reflective of trades in bullion, was up $17.53, or 1.2%, at $1,546.73 per ounce by 2:26 PM ET (18:26 GMT) after the first contraction in U.S. factory activity since 2016 reported by the Institute for Supply Management caused investors to dump risky assets such as oil and stocks and embrace safe havens.
Gold futures for December delivery, traded on the Comex division of the New York Mercantle Exchange, settled up $26.50, or 1.7%, at $1,555.90 per ounce as the benchmark 10-Year Treasury yield hit its lowest level since July 2016.
Gold has thrived on bad news this year. And there’s plenty of scope for disappointing news ahead, from the ongoing trade war to potential for dismal European manufacturing or retail sales data.
Gold needs to rise about 25% more in order to to rewrite record highs above $1,900 set in 2011. With four months before the year comes to a close, there’s little probability that it will rise that much. Yet, some gold longs are betting that this will be a phenomenal year for the cherished safe haven - meaning anything is possible.
As risk assets took a beating and global central banks confirmed a shift to looser monetary policy in August, inflows in gold ETFs rose 101.9 tons, hitting the highest level since February 2013.
That third-consecutive-month surge brought total assets to 2,453.4 tons as of Friday, Bloomberg reported on Monday, after the addition of an aggregated 154.1 tons in June and July.
Futures hit six-year highs of $1,565 per ounce on August 26, coming within $350 of making a new record high that would smash 2011's peak of $1,911.60. It is up almost 19% on the year.
Bullion hit 2013 highs on August 29, reaching $1,550.42. That puts it about $370 short of its 2011 peak of $1,920.80. Bullion is up more than 20% on the year.
Investing.com’s Daily Technical Indicator has a strong buy recommendation on futures and bullion.
Goldman Sachs (NYSE:GS) said earlier this week that gold prices were likely to advance further as central banks continue their buying of bullion bars and demand for gold ETFs continues to rise.
Markets, meanwhile, are pricing in an additional 25-basis-point cut in rates at the Federal Reserve’s next policy decision meeting, scheduled for Sept. 17-18. Lower interest rates tend to support gold by reducing the yield on bonds, which compete for the capital of risk-averse investors.
Central banks across a group of 37 developing economies showed a net 14 rate cuts last month, the highest number since policymakers' hefty stimulus measures that followed the 2008 financial crisis, Reuters reported.
Minneapolis Fed President Neel Kashkari, New York Fed President John Williams and Chicago Fed President Charles Evans speak at events on Wednesday that could shed light on the Fed’s direction for rates.