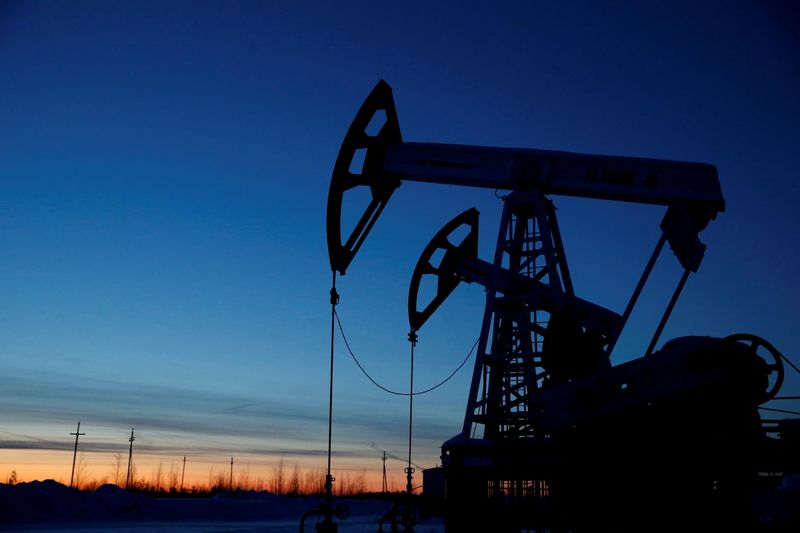
Investing.com -- The economy and geopolitics basically rule supply and demand of commodities. The economy dictates demand more than supply. Geopolitics, conversely, controls supply rather than demand. If what transpired in the just-ended week was economic worry depressing the price of oil, then you’re likely to get some of the opposite this week: geopolitics, in the form of the Israel-Hamas war, driving crude prices up.
How much higher? That’s something even the Saudis probably can’t answer at this moment.
Oil prices fell between 9% and 11% last week, depending whether it's US crude or Brent you’re looking at. It was the biggest weekly slump since March and was deeper than any weekly rally over the past three months. It came as US Treasury yields at 16-year highs and a dollar at a 10-month peak pressured other currencies and economies while consumption of gasoline — the No. 1 fuel product in the United States — was at a seasonal low of 25 years.
The week we are entering is quite a different one. Even without the Israel-Hamas war, the dollar could be one reason for recovery in commodities denominated in the currency, including oil. After reaching its highest level since November on Tuesday, the dollar slid for the remaining three days of last week.
Sunil Kumar Dixit, a technical chartist for markets and regular collaborator with Investing.com, sees profit-taking in the coming week weighing further on theDollar Index, which pits the US currency against six other majors, namely the euro, yen, pound, Swiss franc, Swedish krona and Canadian dollar.
“The Dollar Index faced strong resistance at that 107.35 high and has started declining, with the 3 Black Crows formation on its daily chart,” said Dixit. “Immediate support is seen at 105.78 which is likely to be breached eventually, exposing 23.6% fibonacci retracement zone 105.52. The path of resistance is likely to shift to 106.50 -106.60.”
“Subsequent weakness below 105.50 will extend decline to 104.70 and 104.35 followed by major support at 103.50 which aligns with 100-day SMA, or Simple Moving Average, as well as the 50% Fibonacci zone.”
That’s for the dollar. Now for the Israel-Hamas conflict, which threatens to redraw power stakes in the Middle East more forcefully than any singular event of the past 30 years.
As aforementioned, how deep an impact it would have on oil prices is not known. But with the showdown itself being in the super-sensitive zone which is central to oil production, an intelligent guess is that prices would be higher in the immediate days as the trade tries to figure out if supply would indeed be affected and to what extent.
In that analysis, all attention would be on Iran, which is tacitly behind Hamas at all times.
Despite its weakened finances in recent years due to US sanctions, Iran remains the Middle East’s third largest economy, after Turkey and Saudi Arabia. More importantly, it is the world’s fifth largest oil producer.
With the Israelis vowing commensurate response for one of the worst attacks ever on their soil, a counter engagement against Tehran, either unilaterally by Jerusalem, or with the combined might of the United States, could have ramifications for the oil trade.
As Bloomberg’s oil columnist, Javier Blas, pointed out in the immediate hours after the Hamas attack, the most immediate impact could come if Israel concludes that Hamas acted on the instructions of Tehran. He referenced the 2019 attack on Saudi facilities, where a chunk of the country’s oil production capacity was taken out by Yemenis whom many suspect were guided from beginning to end by Iran.
“Even if Israel doesn’t immediately respond to Iran, the repercussions will likely affect Iranian oil production,” Blas wrote. “Since late 2022, Washington has turned a blind eye to surging Iranian oil exports, bypassing American sanctions. The priority in Washington was an informal détente with Tehran.”
“As a result, Iranian oil output has surged nearly 700,000 barrels a day this year - the second-largest source of incremental supply in 2023, behind only US shale. The White House is now likely to enforce the sanctions.”
But Blas also concedes that since Russia will benefit from any Middle East oil crisis, the United States might proceed more carefully with all its options.
“If Washington enforces sanctions against Iran, it could create space for Russia’s own sanctioned barrels to both win market share and achieve higher prices. One of the reasons why the White House turned a blind eye on Iranian oil exports is because it hurt Russia.”
“In turn, Venezuela could also benefit, with the White House relaxing sanctions to ease market pressure,” Blas added, referring to another country which the United States has complicated ties with, due to oil.
Blas also makes another interesting point related to oil supply. The crisis, though coming exactly 50 years after the Arab Oil Embargo, isn’t a repeat of that October 1973 crisis. Arab countries aren't attacking Israel in unison, he points out. This time, Egypt, Jordan, Syria, Saudi Arabia and the rest of the Arab world are watching the events from the sidelines, not shaping them, he notes.
“The oil market itself doesn't have any of the pre-October 1973 characteristics,” Blas adds. “Back then, oil demand was surging, and the world had exhausted all its spare production capacity. Today, consumption growth has moderated, and is likely to slow further as electric vehicles become a reality. In addition, Saudi Arabia and the United Arab Emirates have significant spare capacity that they use to curb prices – if they choose to do so.”
To me, the Saudis are another interesting dark horse in this puzzle. In ordinary times, when world oil supply is in a dire shortage, the Saudis will be the ones to rescue it, given their standing as the nation with the highest capacity to produce more.
But the Saudis have become the main driver of the supply squeeze in oil now, carrying out some of the deepest production cuts ever in the history of the kingdom, ostensibly to get $100 or more for a barrel. They almost got there two weeks ago, when global crude benchmark Brent went above $97. Thus, the selloff in the just-ended week must have incensed the Saudis to no end and they are hardly likely to add even a barrel after this as relief to any new supply squeeze related to reprisals from this war.
Last but not least, President Joe Biden could again turn to the US oil reserve if the supply situation got too tight to the extent that prices shot way above $100, Blas said. Stockpiles in the US Strategic Petroleum Reserve are already at their lowest since the 1980s after the president released some 200 million barrels over the past two years to plug shortages which drove pump prices of gasoline to record highs of $5 last summer. “The reserve still has enough oil to deal with another crisis,” Blas said.
In conclusion, I’ll say that geopolitics tends to have an intense and outsized impact on anything, but its effect is also typically shorter and less pronounced than that caused by the economy. That’s why I said at the outset that while this war would most likely push crude prices up in the immediate term, it’s hard to predict how long that would be the case.
Oil: Market Settlements and Activity
New York-traded West Texas Intermediate, or WTI, crude for delivery in November posted a final trade of $82.81 a barrel, after officially settling at $82.79, up 48 cents, or 0.6%.
That was a rebound from the 8% slump of the past two sessions, although the US crude benchmark did make a fresh five-week low of $81.53 on the day.
London-traded Brent for the most-active December contract had a last trade of $84.43, after officially settling at $84.57, up 54 cents, or 0.6%, returning to the green lane after also seeing a drop of some 8% between Wednesday and Thursday.
Like WTI, the global crude benchmark printed a five week low in the latest session, falling to $83.50.
For the week, the US crude benchmark was down 9% while its UK peer fell 11%. That was the worst week since March for both.
Oil: WTI Technical Outlook
Following the previous week's indecision after resistance at $95, WTI reacted to headwinds that sent it smashing through the 100-week SMA of $86.15 and reached $81.50, in close vicinity to the 50-week EMA, or Exponential Moving Average of $80.90.
“Break below this zone may cause some limited consolidation to weekly middle Bollinger Band $79.30,” Dixit said. “We, however, expect resumption of strong demand from the support zone as value buyers await in anticipation of an imminent new leg higher beyond the recent high of $95.”
Gold: Market Settlements and Activity
While futures of gold on New York’s Comex, as well as the spot price of bullion traded globally, were up on the day, on a weekly basis both fell for a third week in a row, responding to the relentless selloff of late in bonds and the rally in the dollar.
Gold’s most-active futures contract on New York’s Comex, December, did a final trade of $1,847 an ounce after officially settling Friday's trading at $1845.20, up $13.40, or 0.7%. It hit a seven-month low of $1,823.55 earlier.
The spot price of gold, more closely watched by some traders than futures, settled $1,832.59, up $12.33, or 0.7%, on the day. Spot gold hit a 7-month low of $1,810.47 earlier in the day.
Gold: Spot Price Outlook
Dixit’s outlook: “Gold dropped to $1,810, below the 200 week SMA of $1,815 and triggered retail short covering in the wake of a weekend full of uncertainties. The rebound caused sharp recovery to $1,835 to close at 5 Day EMA of $1,832.
“RSI and Stochastics begin to turn north, hinting at strong rebound which immediately targets 4 Hour 50 EMA $1,846 and 100 Week SMA $1,855. Above this zone, the bullish rebound is expected to continue with targets $1,863-$1,869, followed by $1,881. Any correction to $1928-$1820 may be considered a buying opportunity.”
“Tensions erupted in the Israel vs Palestine conflict puts a geopolitical crisis on an explosive situation, which is certain to trigger panic demand for safe-haven buying in gold. The rally is likely to reach $1927 in a quick chase.”
Natural gas: Market Settlements and Activity
Things are beginning to look up for the natural gas bull, after months and months of haplessness.
America’s favorite fuel for indoor heating and cooling reinforced its hold on $3 pricing on Friday as futures on the New York Mercantile Exchange’s Henry Hub scored double-digit gains for a second straight week.
Turnaround in the prospects of gas, which prior to this was stuck at mid-$2 levels for most of the year, came as weather, demand and production synced in the positive to support higher pricing.
Aiding the bull fervor was gas storage data showing a smallish build for last week, contrary to expectations for a larger one, as some lingering warmth before the advent of cooler fall temperatures led to more air-conditioning demand.
The most-active November gas contract on the New York Mercantile Exchange’s Henry Hub settled Friday’s trade at $3.33 per mmBtu, or million metric British thermal units, up 17 cents, or 5.4%, on the day. For the week, November gas gained 14%, adding to the prior week’s advance of 11%.
This week’s rally in gas accelerated after the Energy Information Administration, or EIA, reported a build of just 86 billion cubic feet, or bcf, in storage of the fuel during the week ended Sept. 29, versus the 92 bcf expected by industry analysts tracked by Investing.com. In the prior week to Sept. 22, storage rose by 90 bcf.
Total gas in US storage was at 3.445 trillion cubic feet as of last week, up 11.6% from a year ago, the EIA said. Earlier this year, the storage was more than 20% up year-on-year. On a five-year basis (2018-2022), inventories were just 5.3% higher, down from double-digits earlier this year.
Natural gas: Price Outlook
Dixit’s outlook: “After 33 weeks of consolidation, of which 16 weeks have been spent above the weekly Middle Bollinger Band, natural gas futures finally made a strong breakout above the critical barrier of the 50-week EMA of $3.35. As long as $2.82 holds as support, continuation of the uptrend targets the 200-week SMA statically aligned with $3.77, followed by the next challenge at the psychological handle $4.”
Disclaimer: Barani Krishnan does not hold positions in the commodities and securities he writes about.