
- All Instrument Types
- Indices
- Equities
- ETFs
- Funds
- Commodities
- Currencies
- Crypto
- Bonds
- Certificates
Please try another search

Discover Your Next Winning Stocks with Our Powerful New Stock Screener
In a world where 90% of individual investors struggle to pick the right stocks and often lose money, while hedge funds enjoy great returns, finding the best investment opportunities can feel like an uphill battle.
With more than 100,000 stocks across 135 countries, how do you cut through the noise to find the best choices that match your personal investing approach without spending lots of time that individual investors usually don't have?
That’s exactly where Investing.com’s new free Stock Screener comes in.
By connecting you to the most reliable data sources (typically reserved for investment firms), and pairing them with a user-friendly interface so you can quickly filter through 167 customized metrics—it’s like cherry-picking stocks, on steroids.
For example, maybe you only want to invest in stocks with high dividend yields, or stocks in a specific sector, or stocks with high earnings growth rates. Knowing which filters to apply can make the difference between an average 7% annual return with the S&P 500 versus a 23% annual return as you’ll soon see in the example below…
And since it covers over 99% of the world market cap, our Stock Screener helps you find local and global opportunities alike.
Beginners? Start by Choosing One of Our Predefined Screens
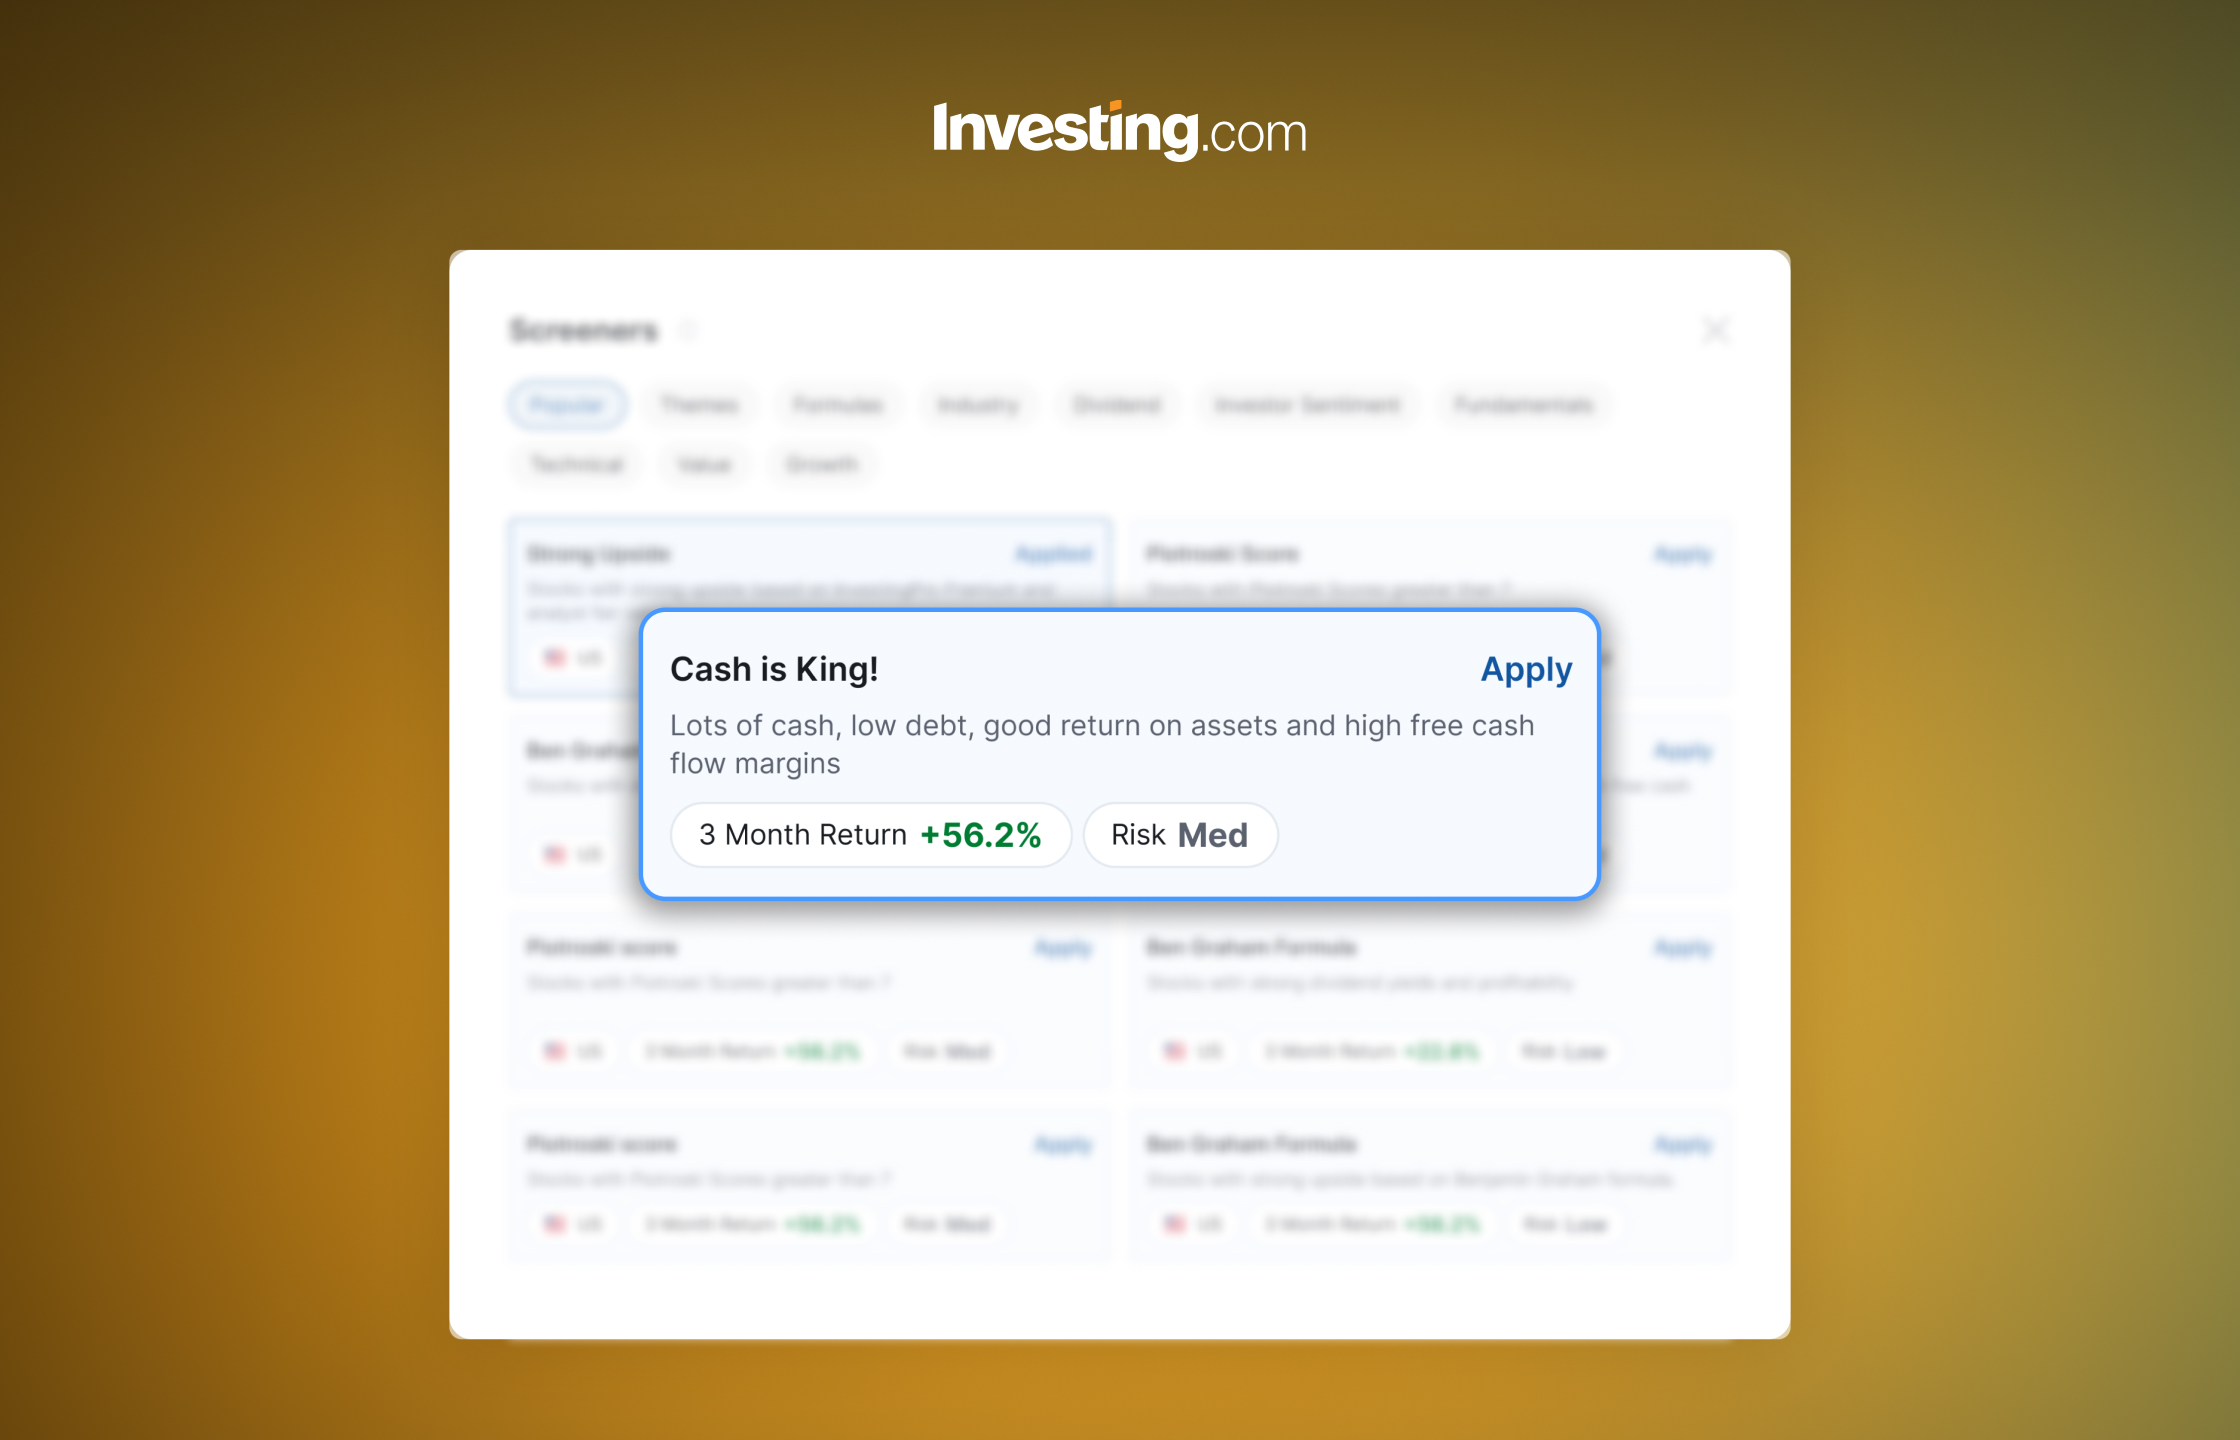
For some retail investors, selecting screener filters on their own may be time consuming or overwhelming. Mostly because it takes time to understand what each screener filter stands for and what they consider as good or bad. If that sounds like you, just choose from our predefined screens with selected filters that copy a variety of notable investment strategies.
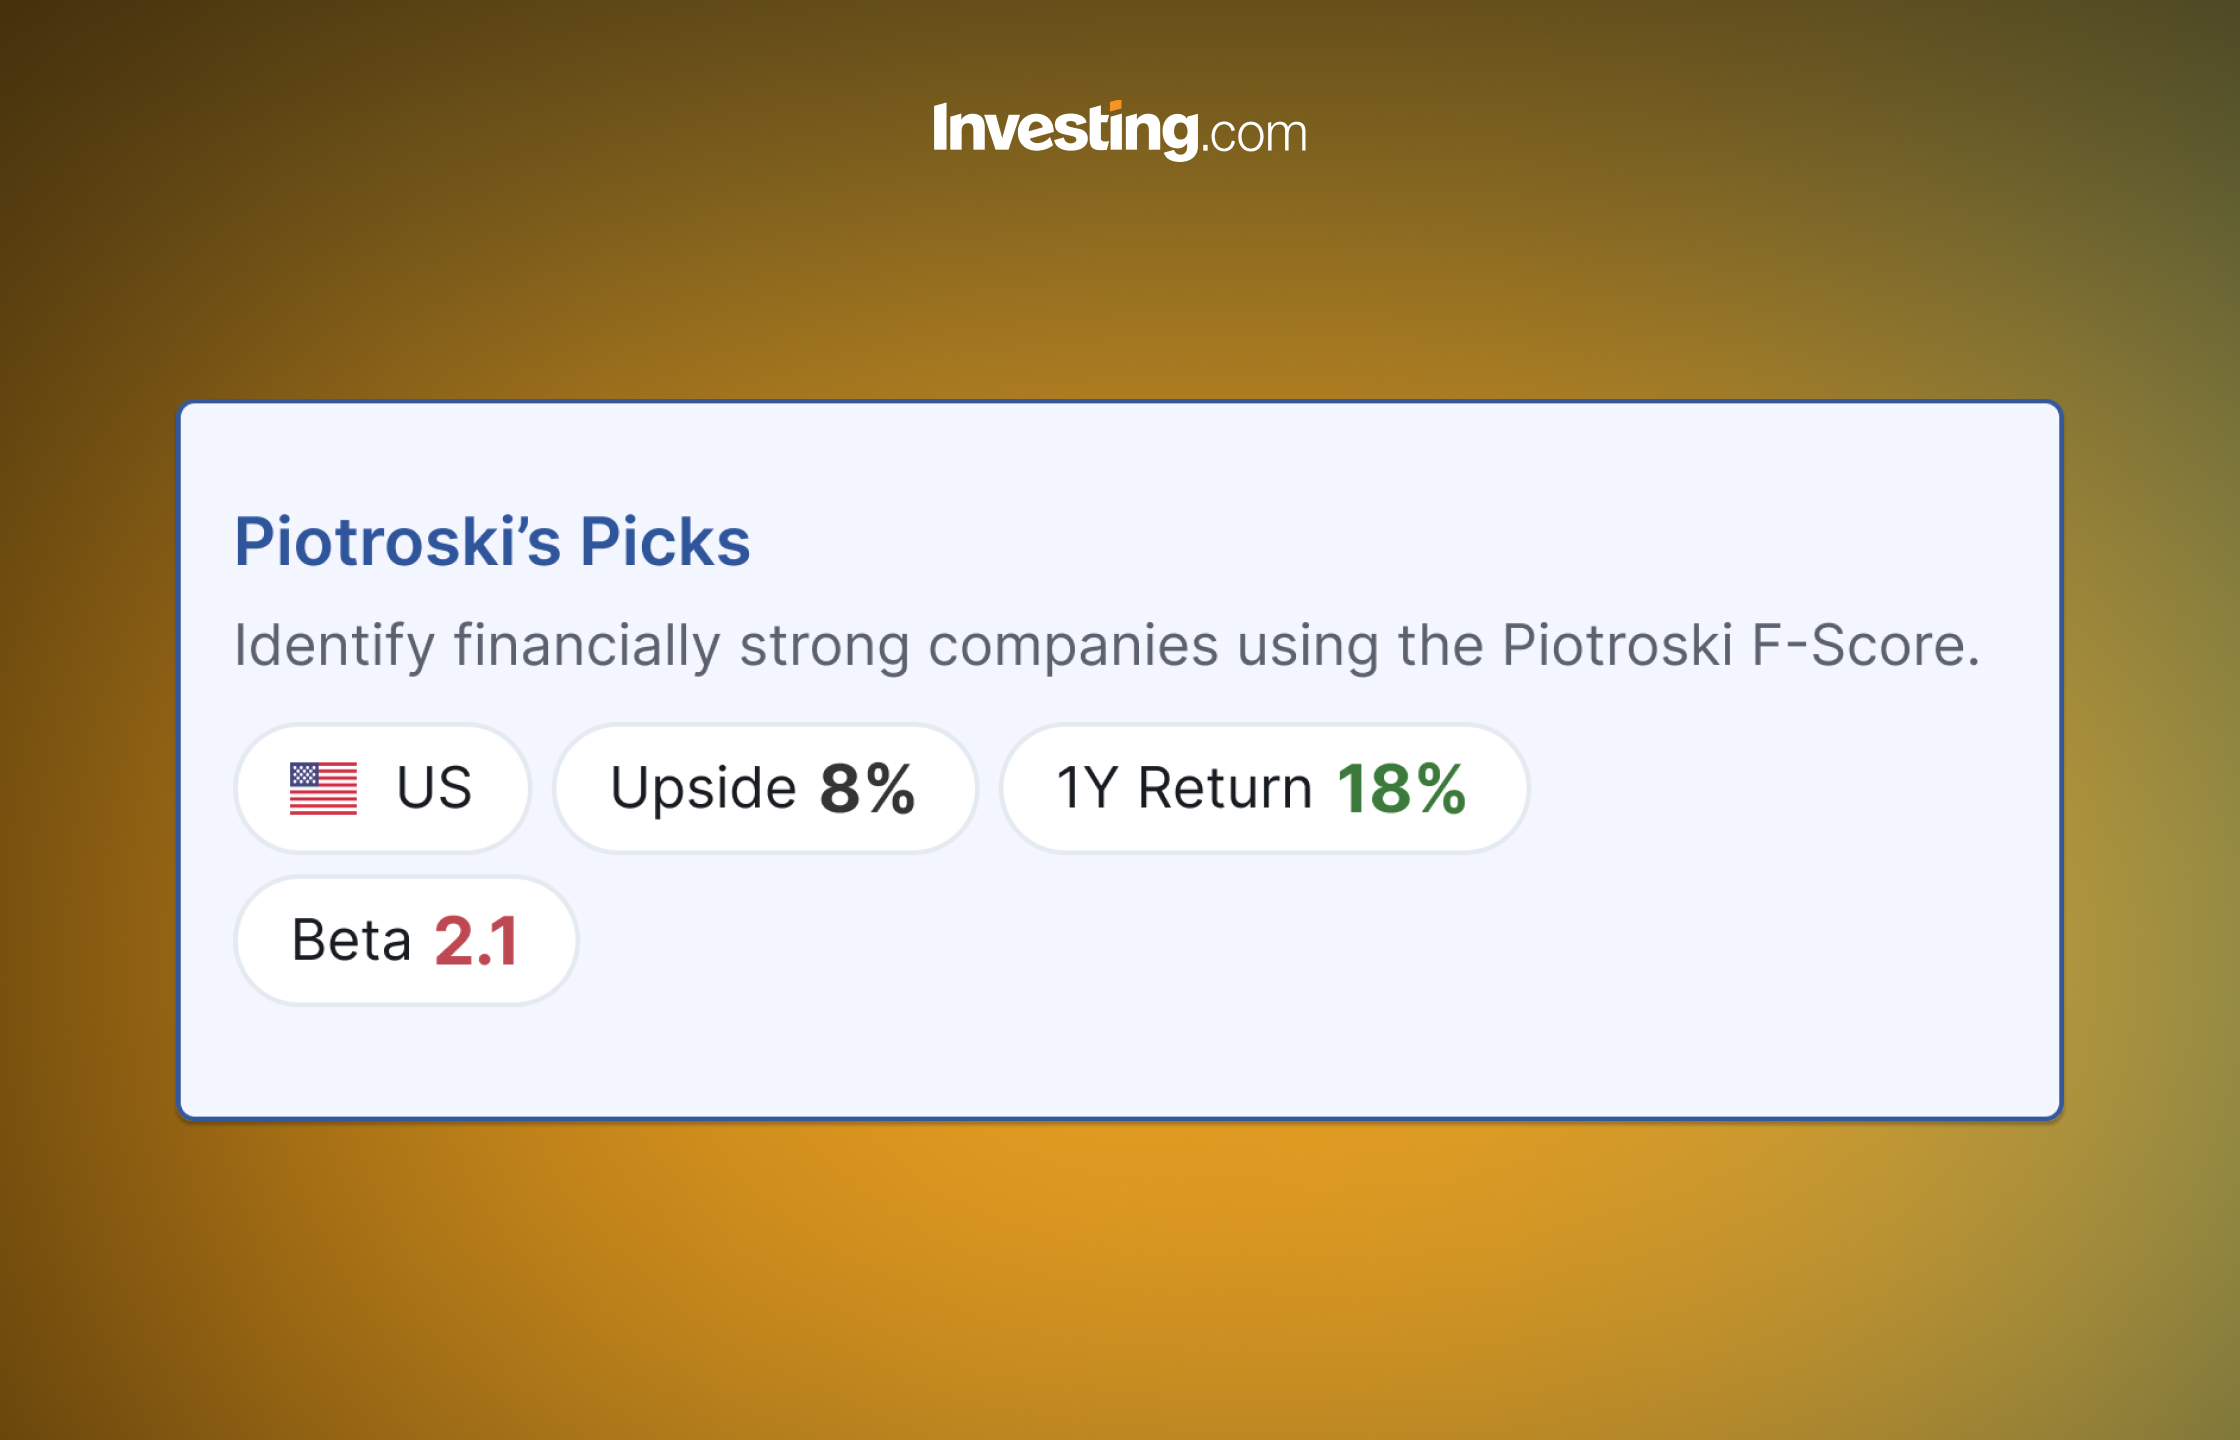
Let’s consider the Piotroski’s Picks predefined screen based on the Piotroski method:
Stanford professor Joseph Piotroski pioneered a groundbreaking approach to estimate corporate financial strength. His methodology assessed firms across metrics related to liquidity, profitability, and operational efficiency known as an "F-Score”, yielding a remarkable average of 23% annualized return over the two-decade span from 1976 to 1996 [reference].
To put this in perspective, if 20 years ago you had invested $10,000, that amount would have returned $628,206.22.
Not bad, right?
See some of our most popular predefined screens
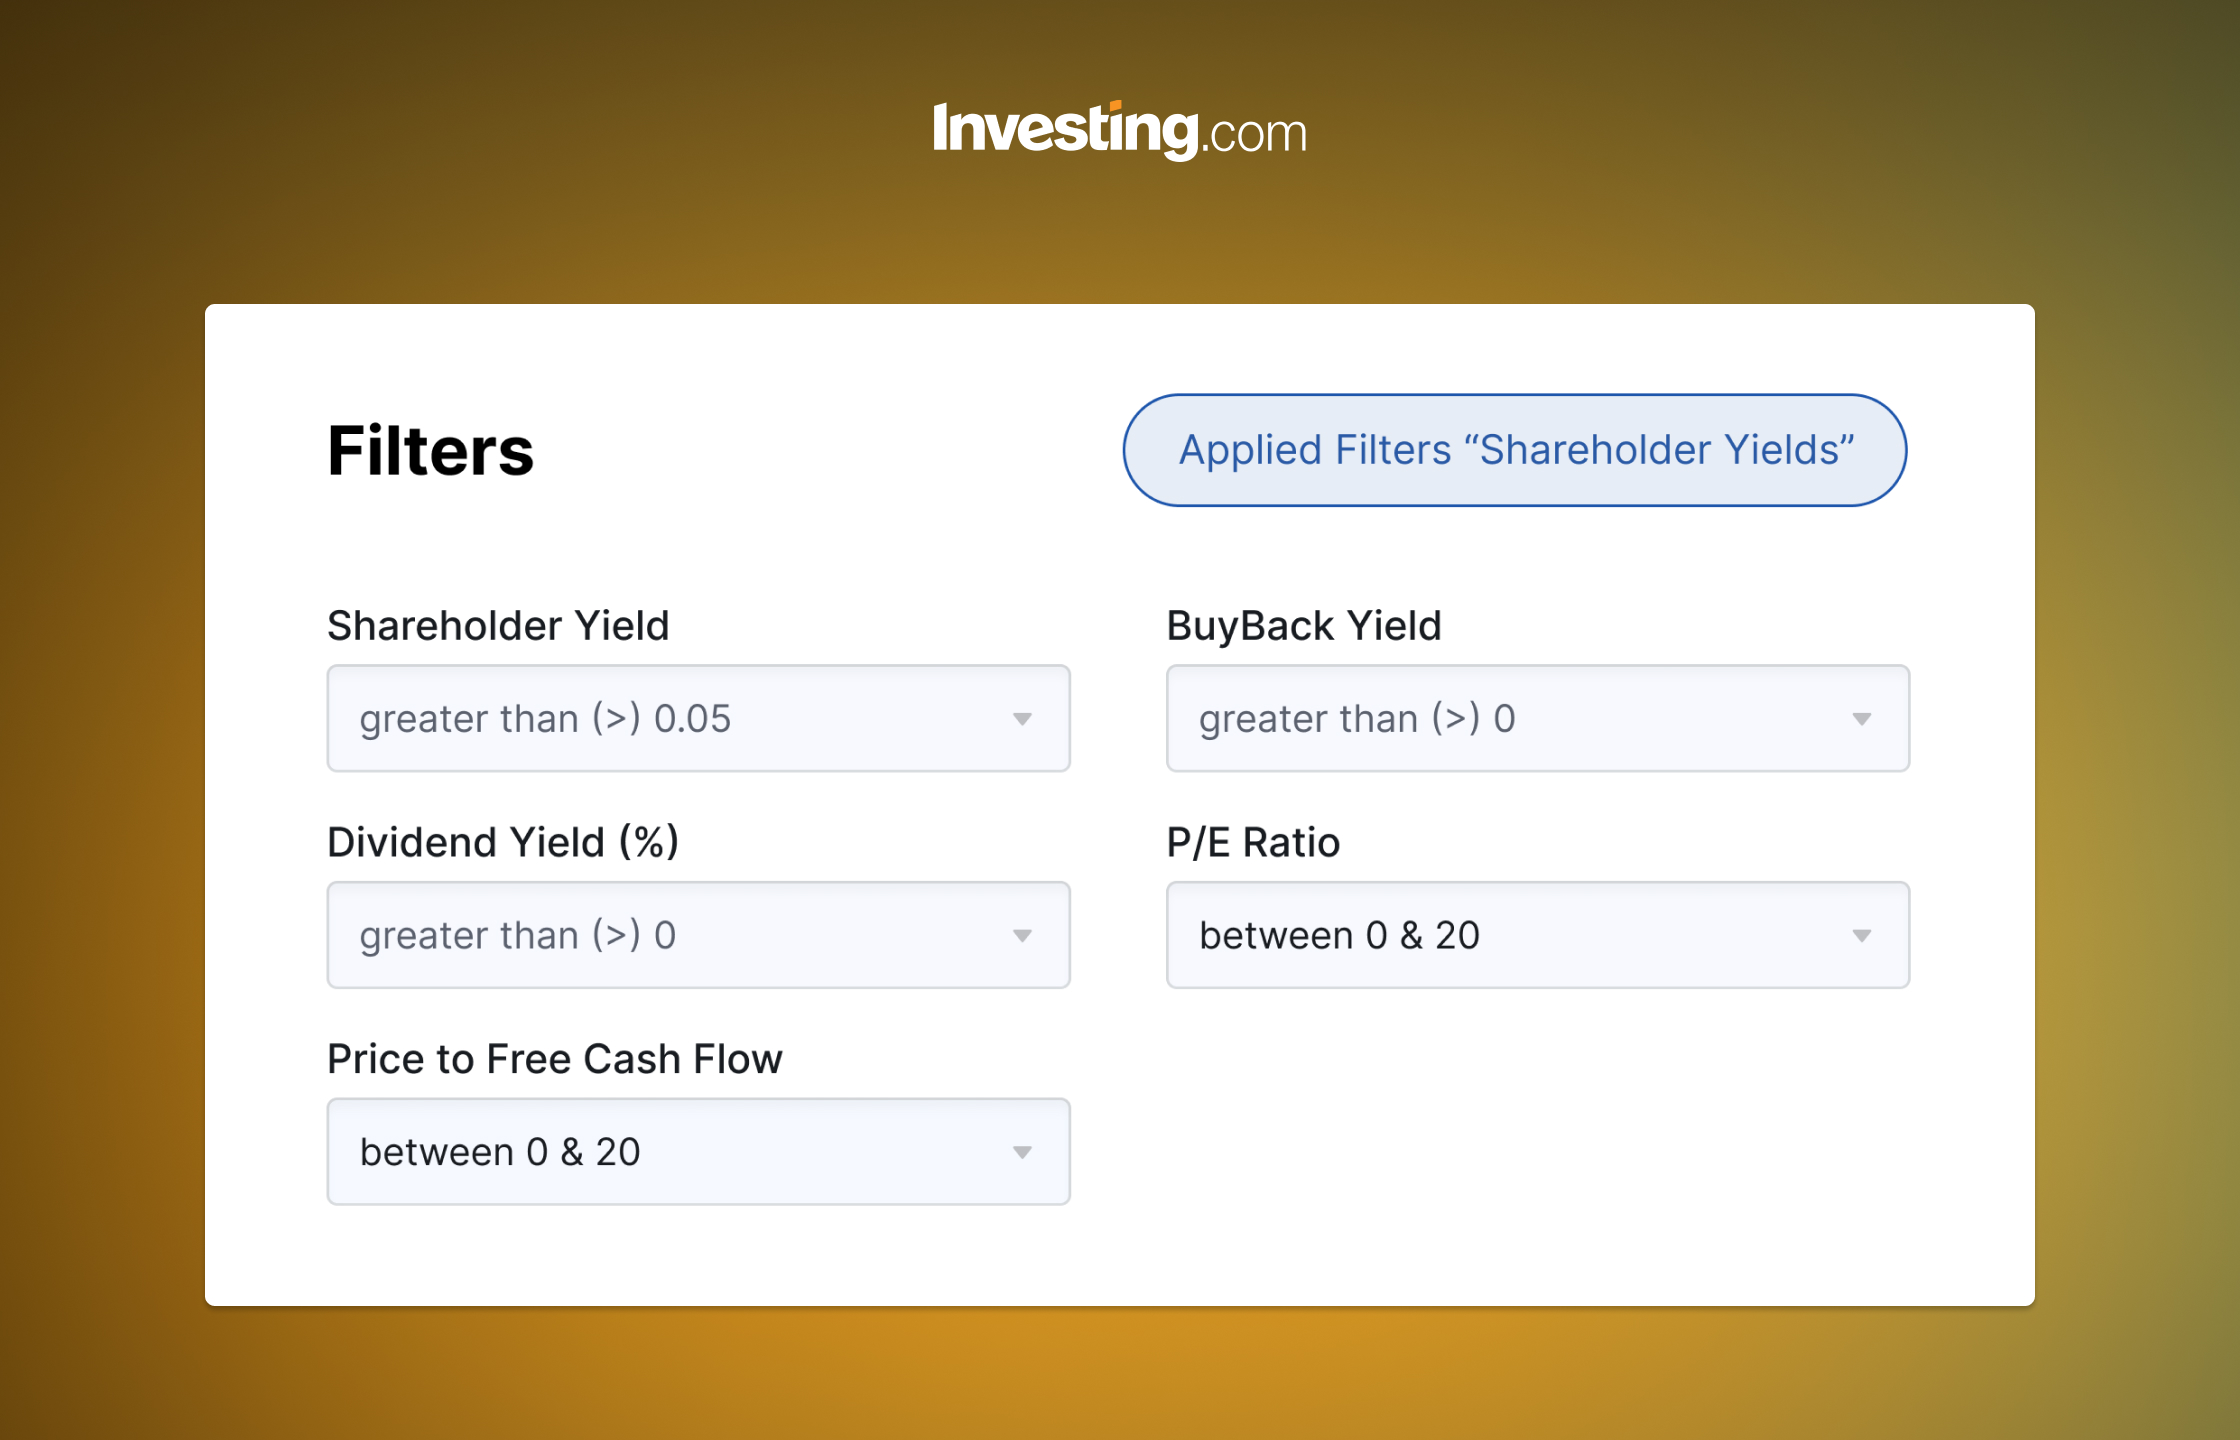
This predefined screen is configured to locate undervalued stocks offering high shareholder yields through dividends and buybacks. One of the interesting filters in this screen is Buyback Yield, a ratio that measures the difference between the amount of share repurchases and the amount of share issuances over the trailing twelve months divided by the company's market capitalization.
We find that buyback announcements precede excess returns. Stocks on average outperformed the equally weighted Russell 3000 by 0.60% over one month, and by 1.38% over one year periods, following buyback announcements. [Reference]
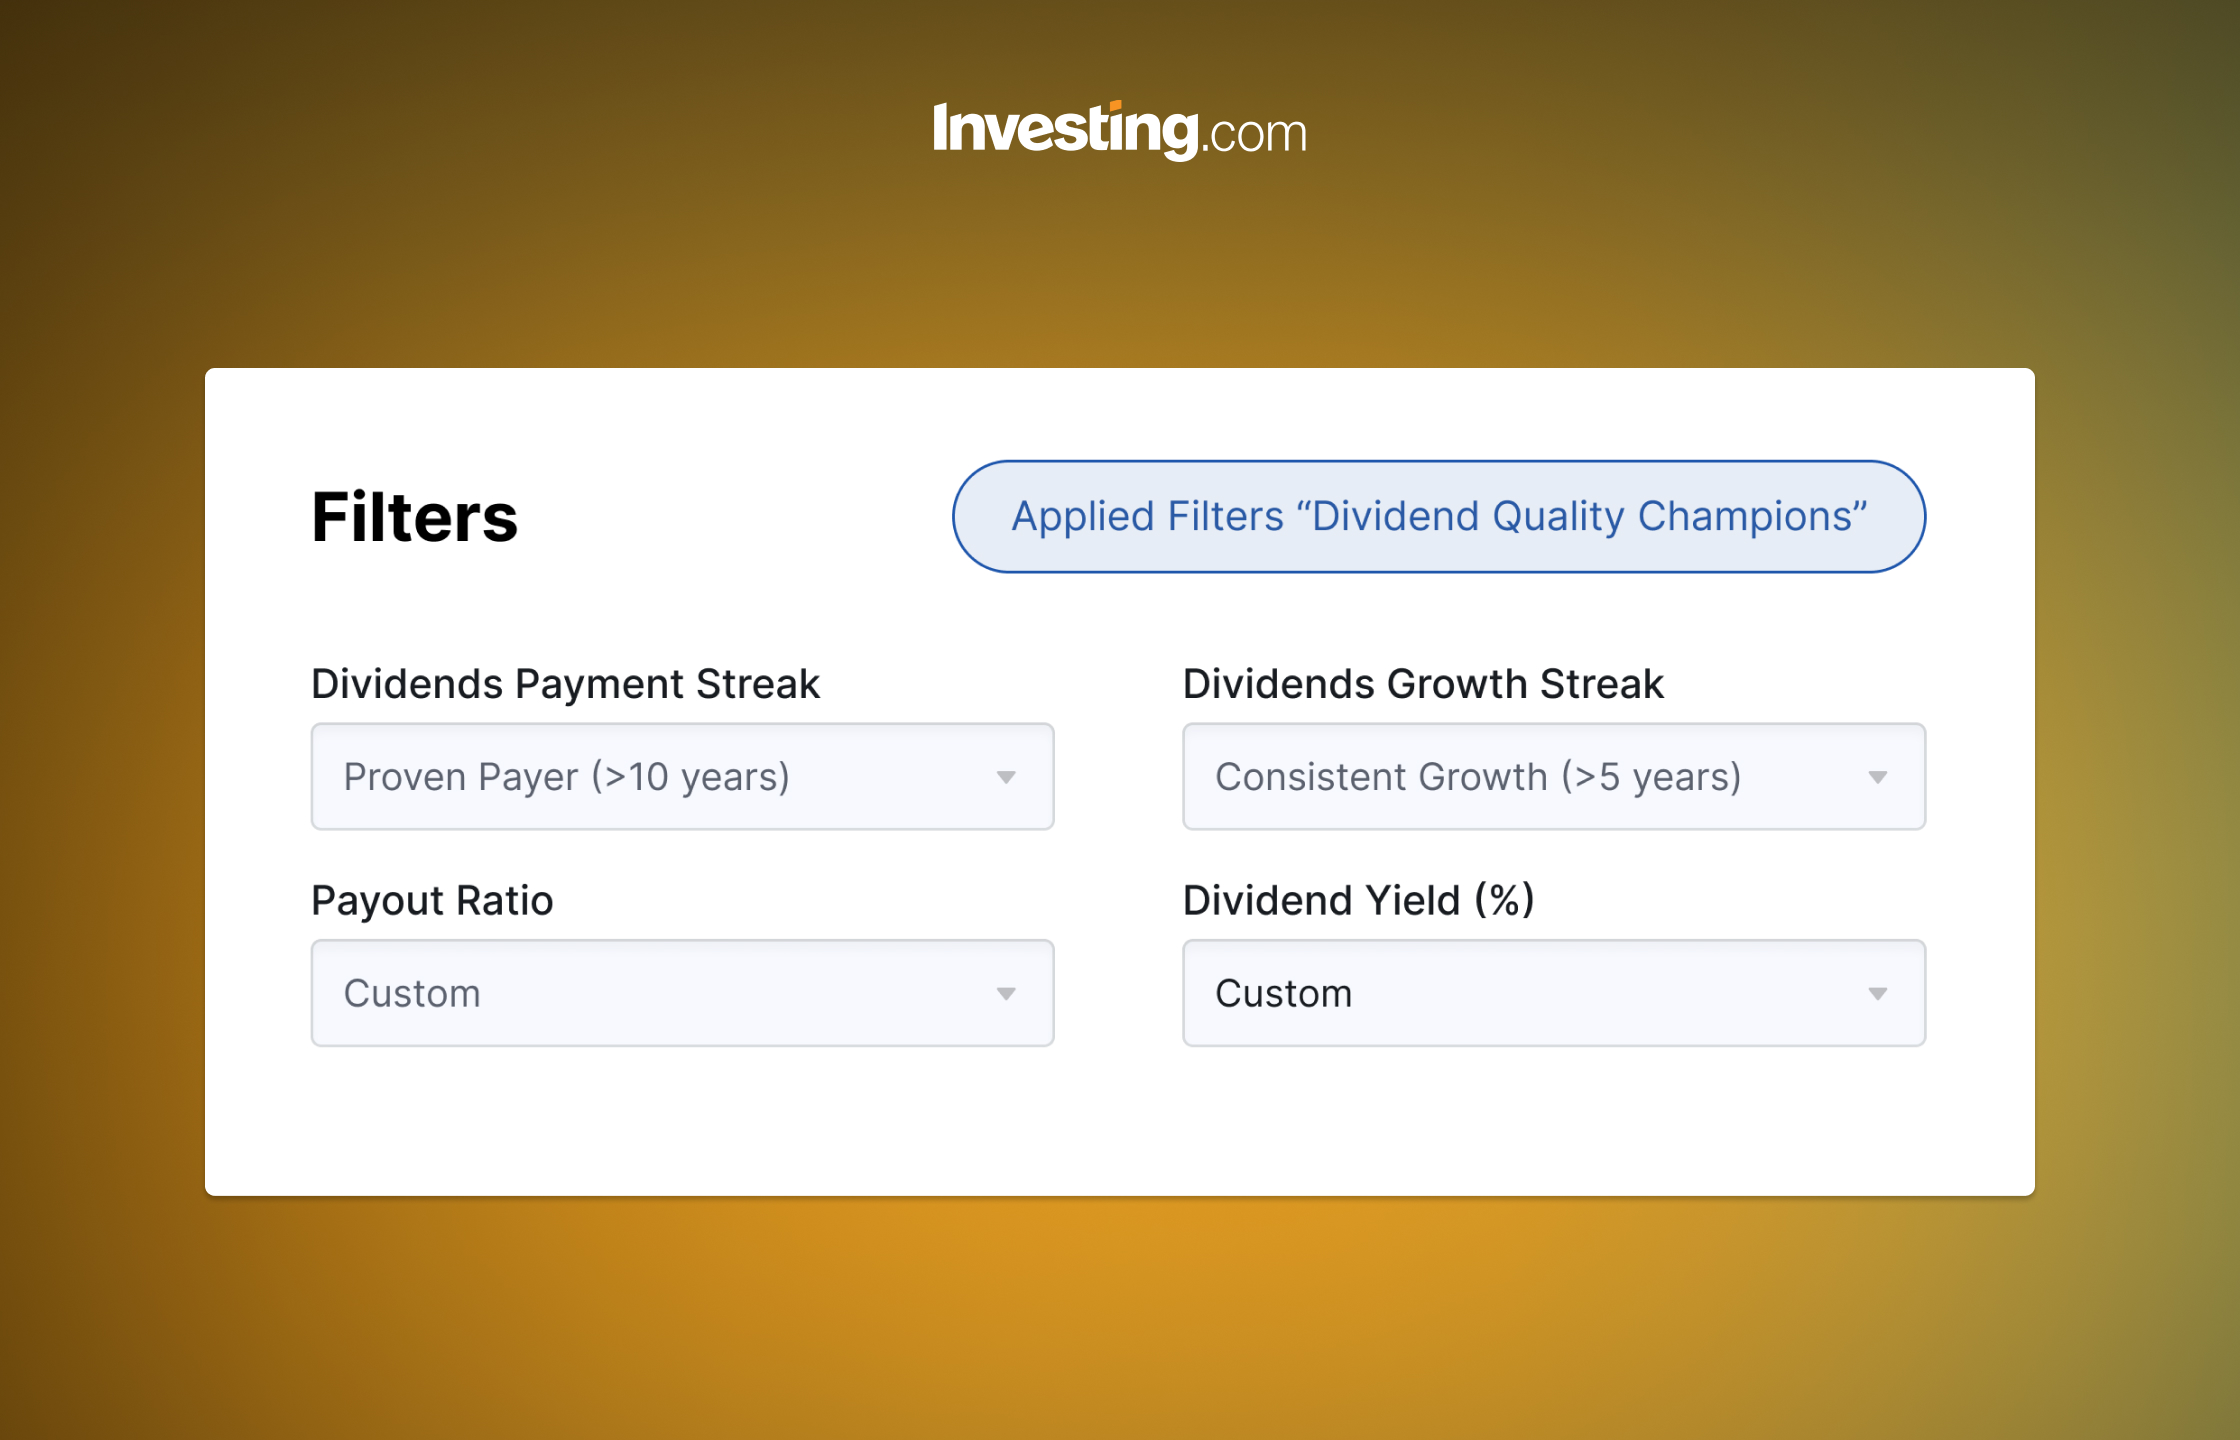
Perfect for investors looking to generate steady income from their investments through dividend-paying stocks, this predefined screen filters for stocks with a history of consistent and growing dividend payments.
One of the key criteria of this dividend stock screener is Dividend Yield, which measures the cash returned to shareholders by a firm as a percentage of the price they pay for each share of stock. Backtest results show that investing in a high dividend yield strategy can result in an annualized return of 10%. [Reference]
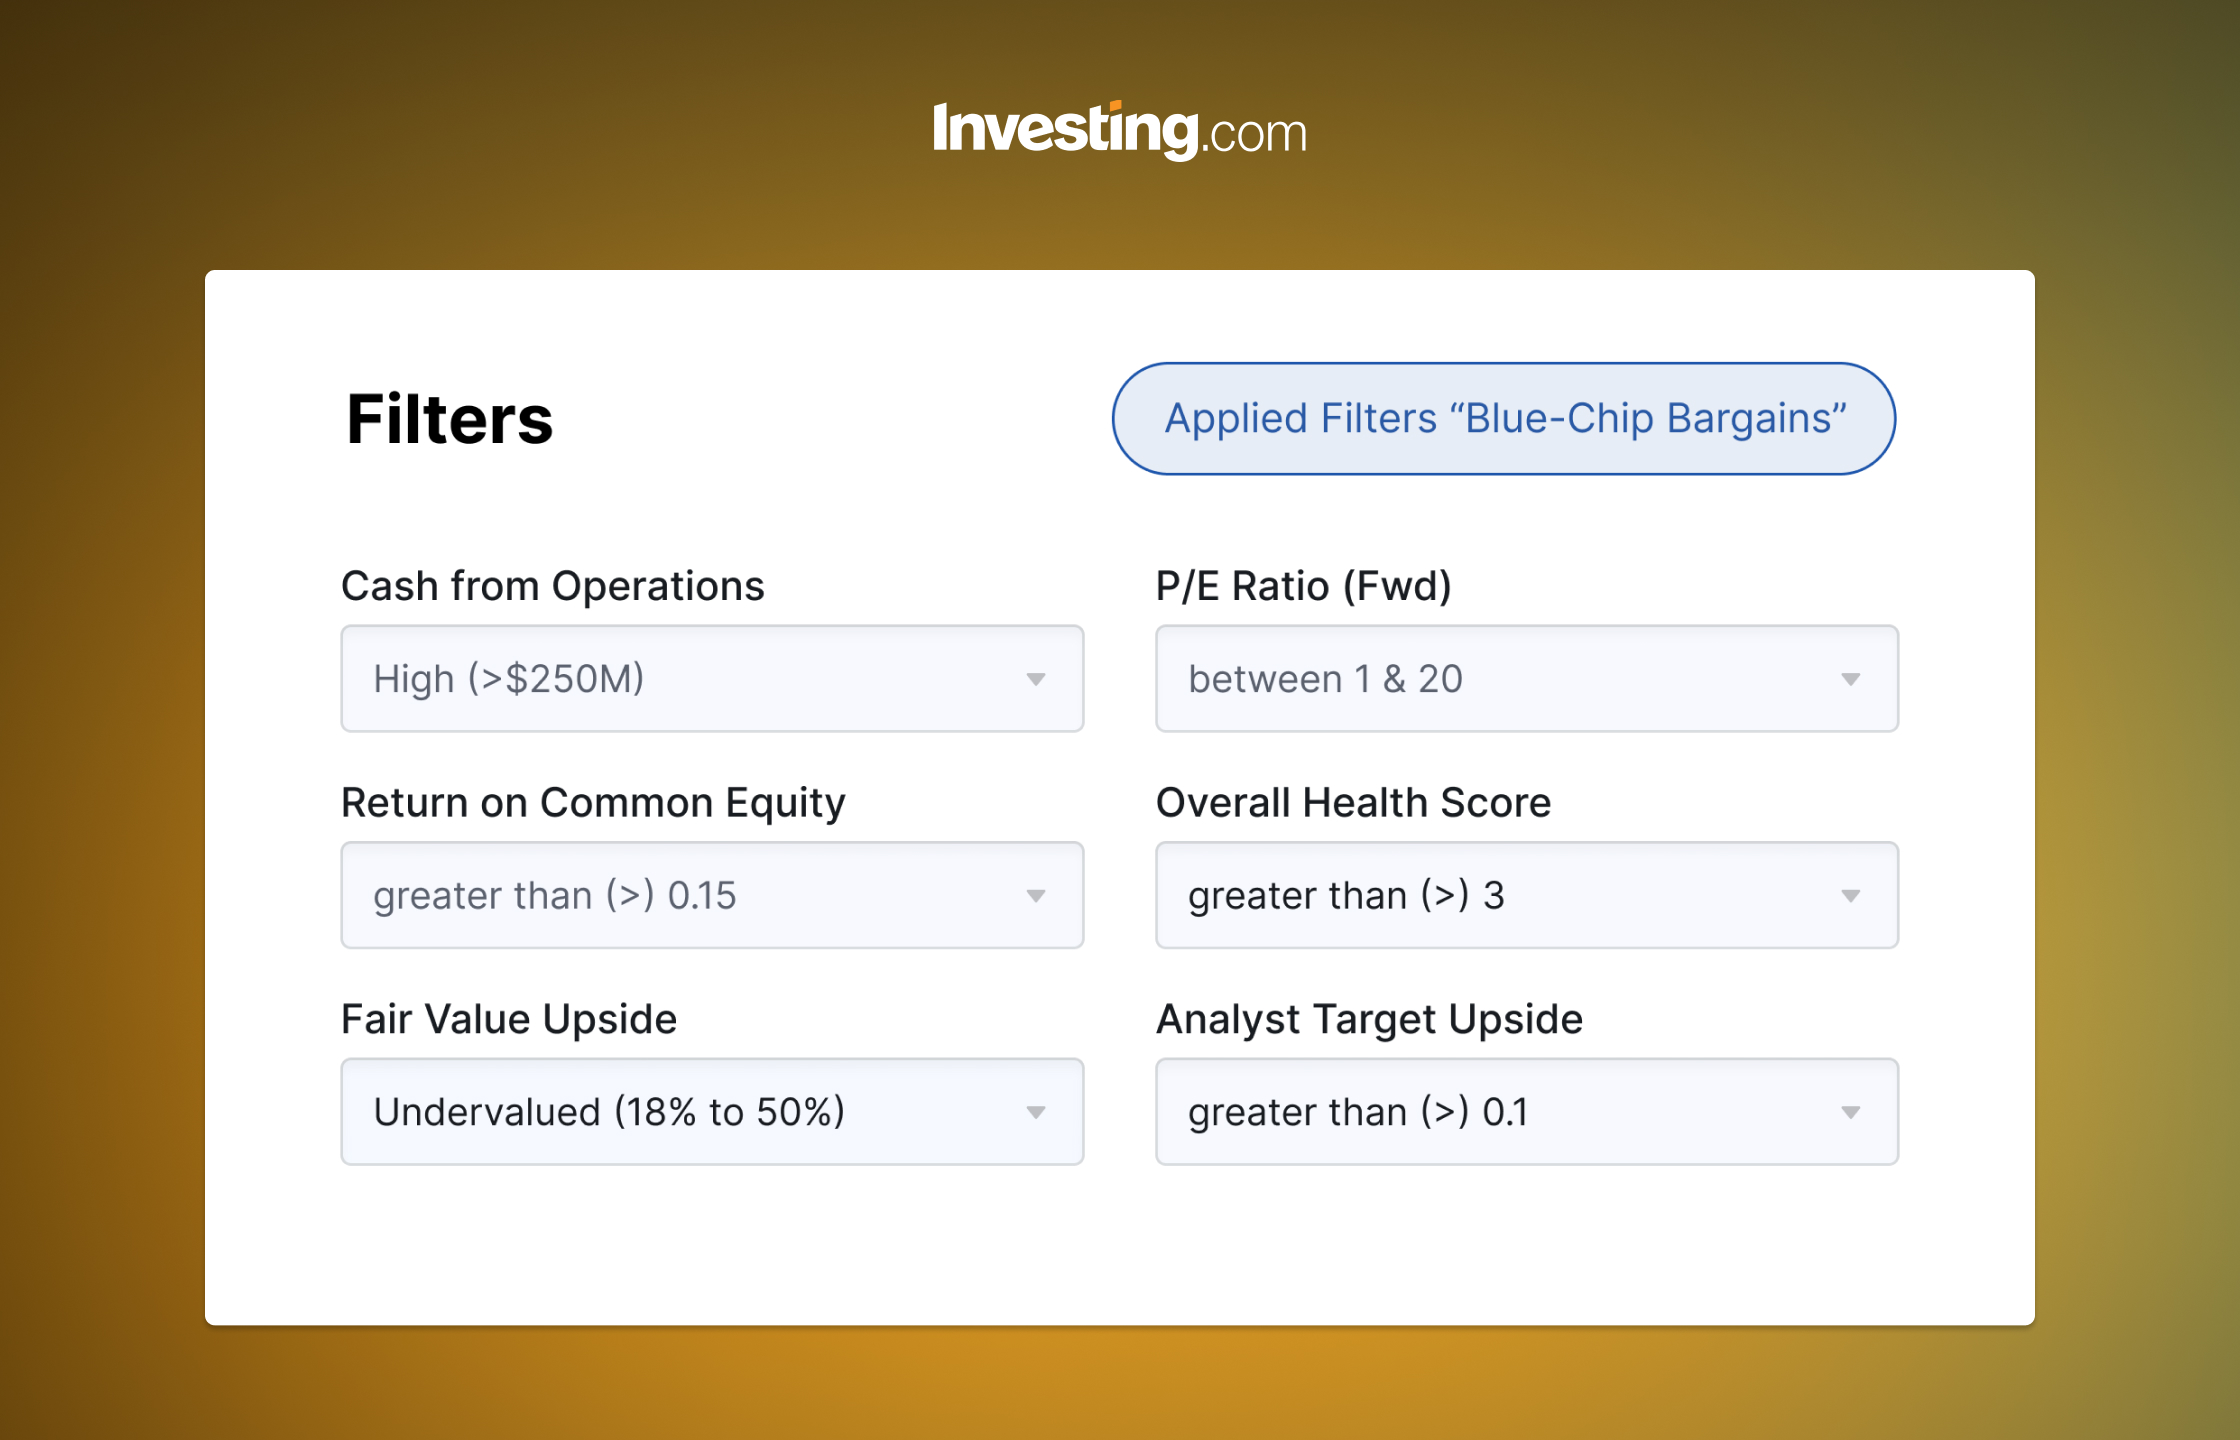
Investors often seek blue-chip stocks because they are well-established companies with a history of stable earnings and dividends. The Blue-Chip Bargains screen helps investors identify these stocks when they are trading at a discounted price, potentially offering a good value for long-term investment.
-
These are just three out of 50+ examples of predefined screens that Investing.com has to offer. Other popular screens you can use are: Analyst Darlings, Talk of the Town, High Beta Bulls, Under $10/Share, Recession Resistant Stocks, and Upcoming Earnings.
Experienced Investor? Build Your Own Advanced Screen
For investors who prefer choosing their selection criteria independently, or to refine an existing predefined screen, Investing.com’s new and improved Stock Screener offers 160+ different filters. These yield initial results which can be further refined using different filter categories: Dividends, Efficiency, Financials, Growth, Price, Returns, Risk, Technical, Valuation, Insights, and Profile.
There may be instances where data needs to be further manipulated to fit specific investment metrics and processes. You can export screener data into structured CSV files to create custom models. It's like a personal data assistant, providing the raw materials for investment strategies.
Get started with the 9 most popular filters on Investing.com
• Market Capitalization - Market capitalization shows how much a company is worth as determined by the total market value of all outstanding shares. You can filter according to the following:
- Large-Cap: > $10B
- Mid-Cap: $2B to $10B
- Small-Cap: $300M to $2B
- Micro-Cap: $50M to $300M
- Nano-Cap: < $50M
• Index Membership: Filter companies based on where they are indexed. For example, filter only companies that are indexed under the S&P 500, Dow Jones, NASDAQ, Small Cap 2000, DAX, CAC 40, IBEX 35 or BIST 100, etc.
• Dividend Yield: Filter companies based on how much cash they return to shareholders. For example, JPMorgan [NYSE: JPM] as of today (22/05/2024), returns cash to shareholders at a rate of 2.3%.
• Dividends Payment Streak: Find companies based on the uninterrupted length of time that their dividends have been paid out. For example, Exxon [NYSE:XOM] hasn’t missed a dividend payment in 54 years.
• Fair Value Upside: Filter companies that have buy or sell signals based on 17 different industry-recognized valuation models. Find out more here
• Next Earnings Date: The biggest market moves usually happen around earnings updates due to the high volume of information that’s released. Use preset buckets of 1-day, 7-day, etc., to stay up to date about companies that are posting earnings soon. You can also drill further down with this list to focus on tech companies, undervalued stocks, fastest-growing companies—or whatever holds your interest.
• Return on Invested Capital: Find companies with a strong track record of creating value for all stakeholders, debt and equity.
• Revenue: Use this criteria to locate companies that generate total income from their core operational activities.
• YTD Price Total Return: Find stocks “on the rise” based on the total change in price, adjusted for splits, so far this calendar year.
Don’t miss out on the opportunity to leverage Investing.com’s unrivaled range of global market coverage. Expanding regionally beyond your local stock exchange lets you find top stocks that match your criteria in other markets while geographically diversifying your portfolio.
How to Use a Stock Screener
Step 1: Choose a predefined screen or set your own customized filters to filter your way to the cherries that match your initial criteria.
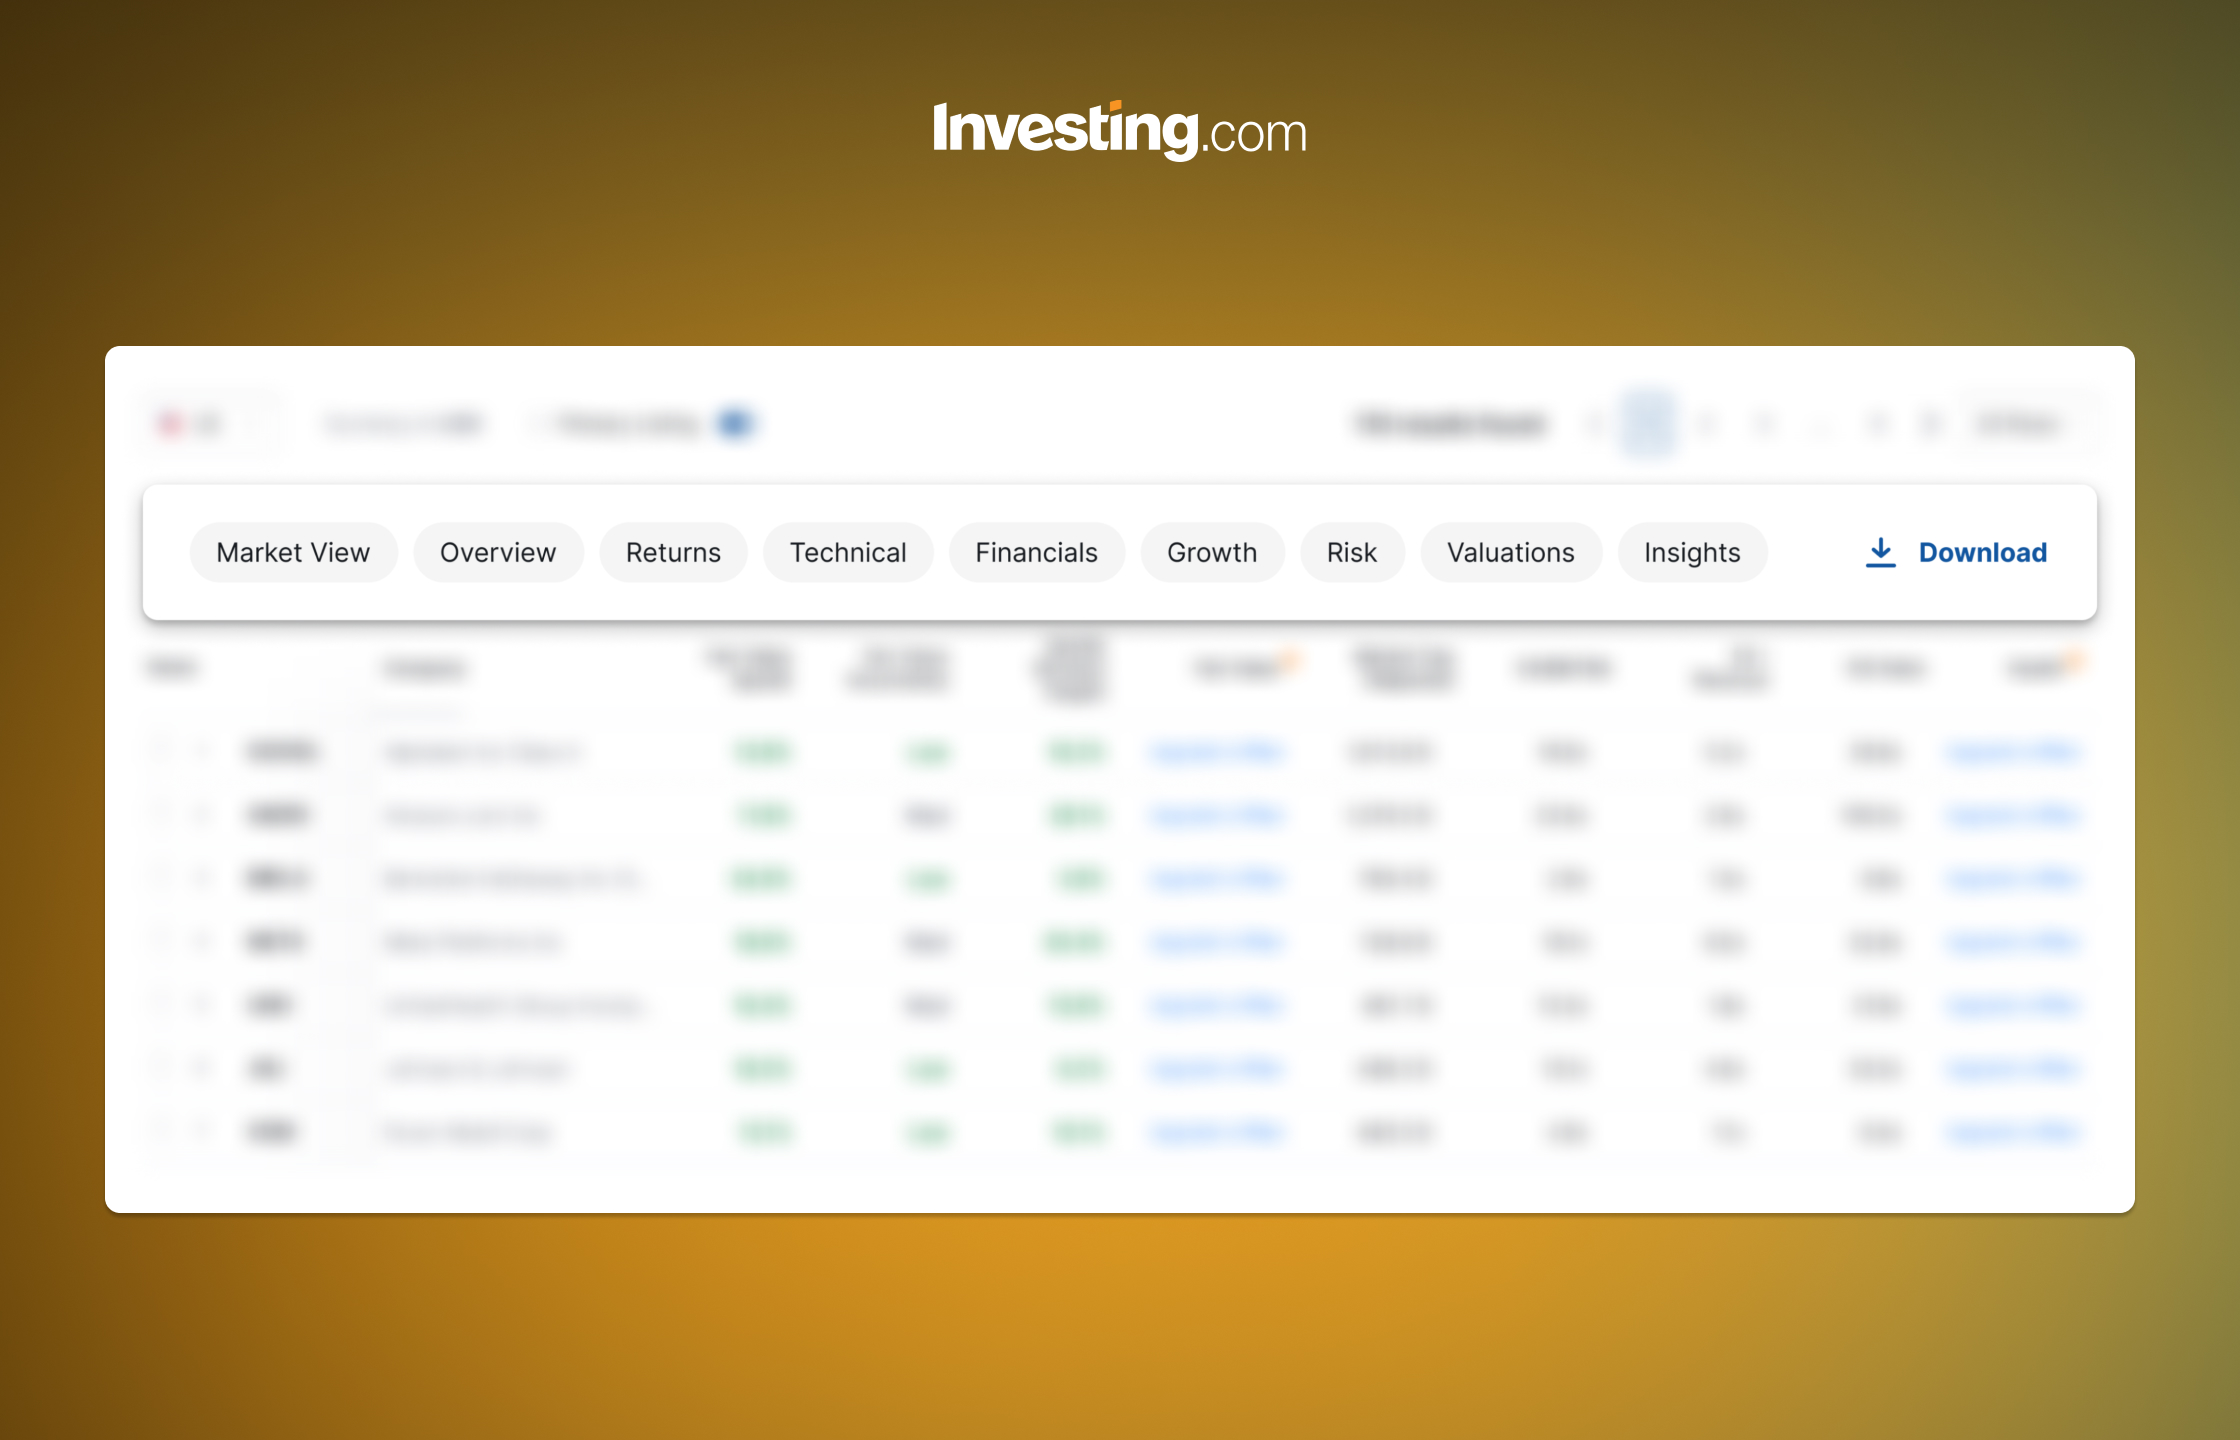
Step 2: Use one of our 9 different views on the stock results you received to identify stocks with the best potential by analyzing various financial and market indicators. For example:
- Insights view: Dive deeper into the company's valuation, analyst coverage, financial health, and proprietary scores to inform your investment thesis.
- Valuations view: Assess the company's current valuation using a range of metrics, including trailing and forward multiples, yield ratios, and enterprise value calculations.
- And other views like: Overview, Returns, Technical, Financials, Growth, Risk or create your own custom view.
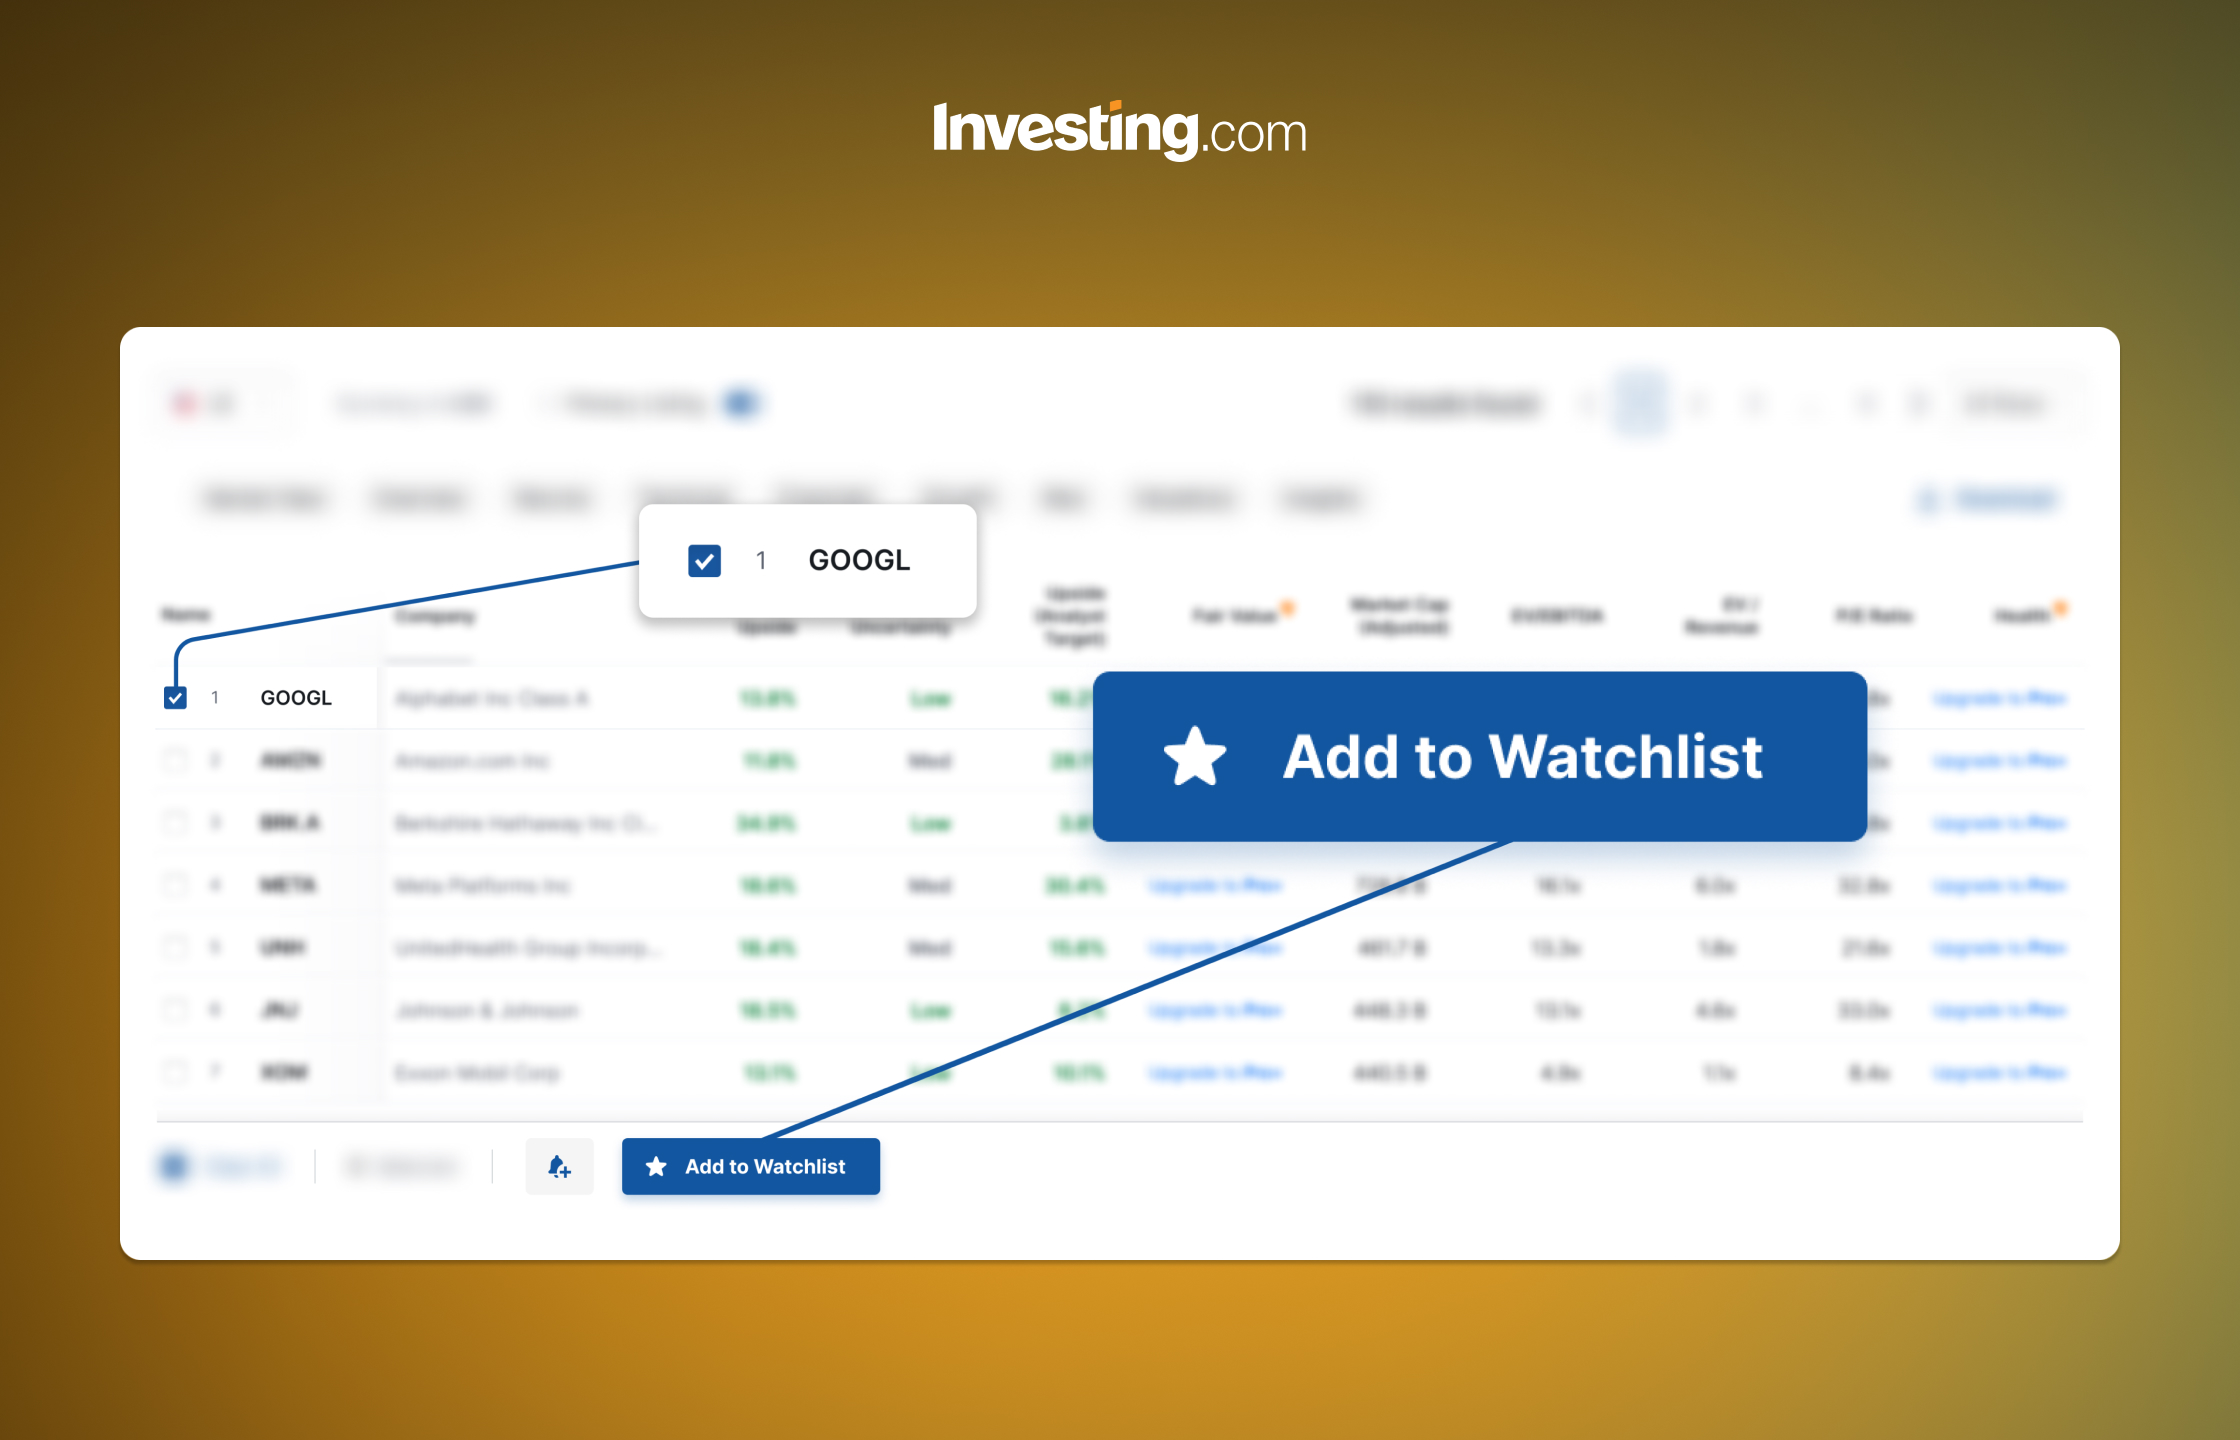
Step 3: Copy your short-listed stocks into a watchlist so you can easily monitor stocks you’re considering to buy.
The Best Stock Screener Out There - Stock Screener Comparison
We might be biased, but there are millions of investors in 35+ countries who trust Investing.com’s Stock Screener.
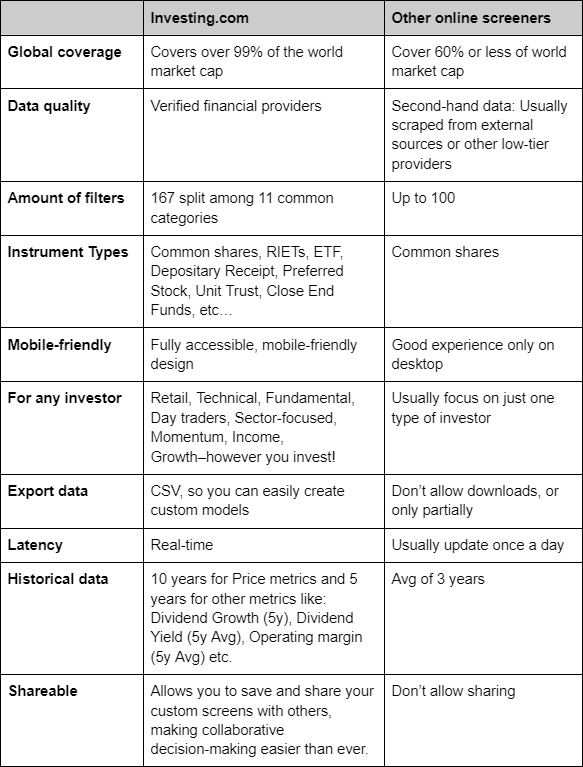
Investing.com's upgraded and supercharged Stock Screener is ideal for investors seeking an edge.
Don't settle for mediocre returns—let the Stock Screener's robust filters and global data uncover those hidden gems poised for explosive growth. Whether you're a savvy veteran or ambitious newcomer, it unlocks professional-grade screening power once reserved for hedge funds.
Are you sure you want to block %USER_NAME%?
By doing so, you and %USER_NAME% will not be able to see any of each other's Investing.com's posts.
%USER_NAME% was successfully added to your Block List
Since you’ve just unblocked this person, you must wait 48 hours before renewing the block.
I feel that this comment is:
Thank You!
Your report has been sent to our moderators for review


Add a Comment
We encourage you to use comments to engage with users, share your perspective and ask questions of authors and each other. However, in order to maintain the high level of discourse we’ve all come to value and expect, please keep the following criteria in mind:
Perpetrators of spam or abuse will be deleted from the site and prohibited from future registration at Investing.com’s discretion.