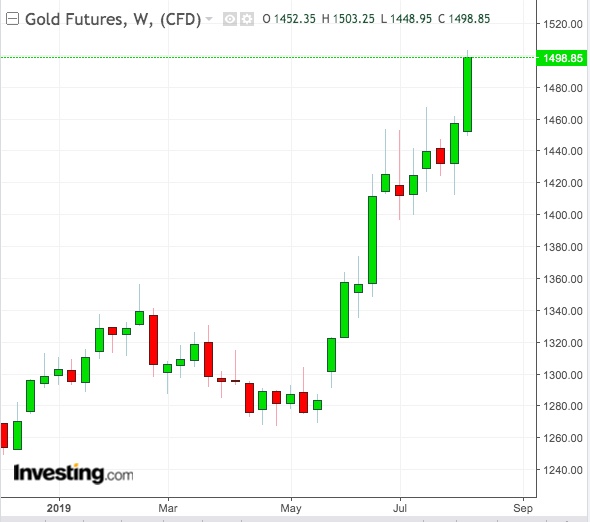
Gold bulls are on a high ride they haven’t been in a while, and the experience could only get more dizzying.
A near decade-long expansion of the U.S. economy had previously trapped gold prices in a multiyear descending trendline, since futures of the yellow metal hit record highs of $1,911.60 per ounce in September 2011.
That vicious cycle may now be broken, thanks to “currency manipulator” China.
With the trade war of the century not appearing to end anytime soon as the Trump administration thinks of new ways to outsmart Beijing for the devaluation of the yuan, gold futures could seek a perch in the $1,800 territory after crossing the $1,500 barrier for the first time in six years on Tuesday.
Gold Rallies On Its Own, Without Dollar’s Help Yet
What’s even more startling is that gold’s breakout this time is predicated almost entirely on its safe-haven quality and not as a countertrade to the U.S. dollar. That’s testimony that gold is on its own this time, becoming a magnet for investors worried about economic and political troubles.
The Dollar Index, which measures the greenback against a basket of six currencies, has been amazingly resilient since the trade war heightened, holding at a steady reading above 97 after the Federal Reserve cut interest rates by 25 basis points last week. This is despite growing bets that U.S. policymakers will be pushed into one or more of deeper rounds of easing in coming months, to respond to the yuan’s devaluation.
Christopher Vecchio, a currency analyst who also plots precious metals strategies, believed gold futures on New York’s Comex have the best shot of returning to their heyday after breaking the multi-year descending trendline from the 2011 high.
Vecchio added:
“The placement of the neckline determines the final upside targets in a potential long-term gold price rally. Since the end of June, gold price action has not done anything to invalidate our longer-term bullish perspective.”
Conservatively, drawing the neckline breakout against the January 2018 high at $1,365.95, and aggressively, drawing the neckline breakout against the August 2013 high at $1,433.61 calls for a final target at $1,820.99.”
At Wednesday’s midday trading in Asia, Comex’s benchmark gold contracts for December delivery were up $14.25, or nearly 1%, at $1,498.45. The session peak was $1,502.25, a high not seen since Aug. 2013.

The futures contract is up nearly 3% on the week, 4% on the month and 14% on the year.
Both Futures And Bullion Deemed 'Strong Buy'
Investing.com’s Daily Technical Outlook pegs gold futures as a “Strong Buy," projecting a near-term top-end resistance of $1,516.66.
Spot gold, reflective of trades in bullion, traded at $1,486.44, after scaling an intraday high of
$1,490.22. Bullion has gained 3% on the week, 5% on the month and almost 16% on the year.
Investing.com’s Daily Technical Outlook also pegs bullion as a “Strong Buy,” projecting a near-term top-end resistance of $1,504.85.
Even If It Falls, It Might Hold At $1,300
So, what if gold’s breakout ends abruptly? Where could it go to?
Fret not, as it’s unlikely to collapse like before, said James Stanley, another currency/precious metals strategist, who saw breakdown to just around the $1,300 levels prevalent since June.
Said Stanley:
“We’re probably not going to see any hawkish major central Banks anytime soon and, likely, pressure will remain on global growth until cessation is seen on a variety of trade issues.”
At this point, it appears as though China’s strategy will be to try to wait out U.S. President Donald Trump through the 2020 election, which can keep that pressure on growth for an extended period of time.”
In such a scenario, he saw gold in a similar context to the post-financial crisis backdrop, when most major central banks around the world were harboring some form of dovish policy, or at the very least considering it.
Stanley added:
“So, if this current phase does end up washing out, similar to what was seen from February-April of this year, longer-term support potential remains at key areas of prior resistance that, as yet, haven’t been tested for support since prices broke-out in June.”
These levels show around 1375 and 1357.50, each of which were previous annual highs that showed as follow-through resistance.”
