It’s incredible, the difference between one Monday and another.
Yet, that’s exactly what we are seeing in the gold market. The yellow metal fell into an abyss two weeks ago, then held its ground defiantly the following week, only to crash again in the latest one.
But through it all, the risk has been the same: COVID-19 vaccine trials and how their progress could change the fate of the greatest pandemic in history.
Adding to that was the White House’s go-ahead late on Monday for the transition of Democrat President-elect Joseph Biden, so that he and his chosen team can escalate the fight against the coronavirus. The news on Monday, that Biden picked former Federal Reserve Chair Janet Yellen as Treasury Secretary, appeared to go down well on Wall Street.
The overnight rush in risk sentiment from all these events brings the gold market to a pivotal point. There’s been lots of speculation whether we would get to that pivot, which started right after gold definitively slipped beneath the $2,000+ record highs of August.
The systemic breakdown that has shattered one support level after another in the $1,900 and $1,800 regions raises the inevitable question: Will gold get to $1,700 territory and, if it does, how long will it remain there?

Charts courtesy of SK Dixit Charting
$1,700 Territory A "Distinct Possibility"
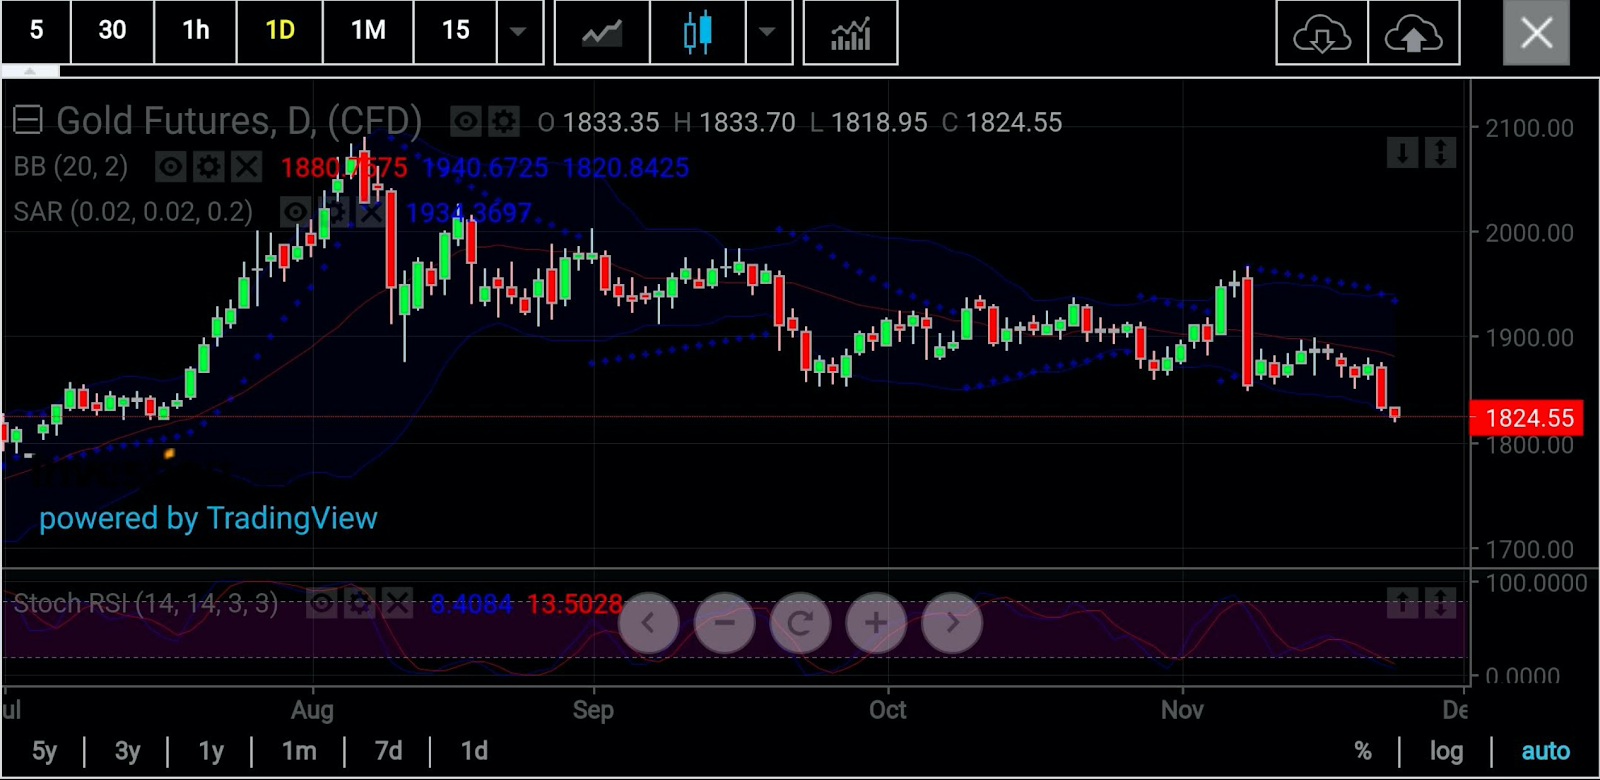
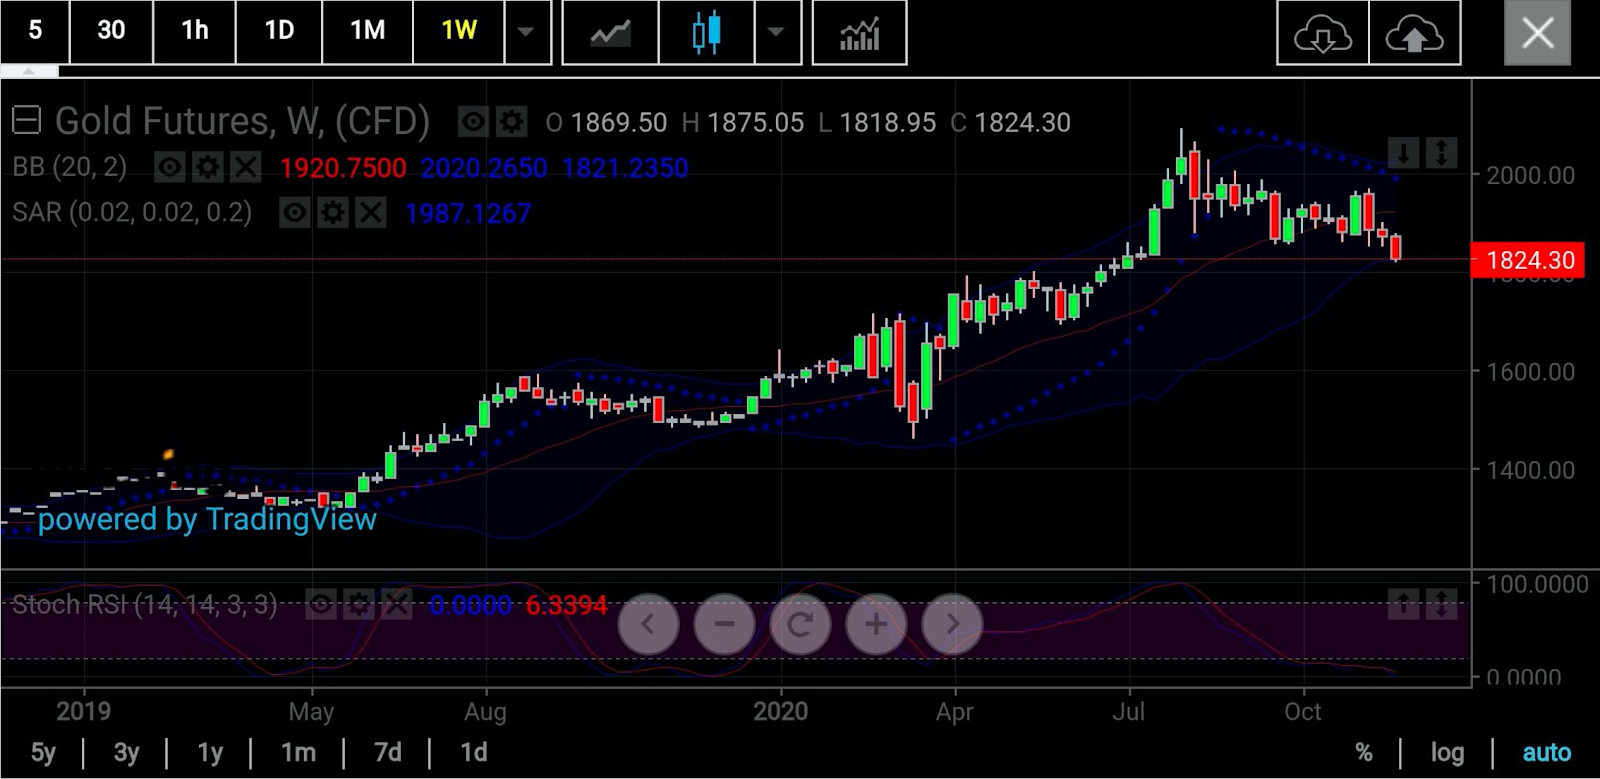
According to Sunil Kumar Dixit, gold chartist at SK Dixit Charting in Kolkata, India, sub-$1,800 is a very distinct possibility for spot gold, or bullion, given the extremely bearish candlestick on the charts over the past 24 hours.
That said, a powerful rebound back into $1,800 territory is likely almost as soon as gold trades under that level, or down to as far as $1,768, he adds. Dixit said:
“The last vestige of technical support in the $1,800 level is $1,818 and if that’s broken, it could take gold through the $1,700 motions of $1,795 and $1,768. That said, anyone shorting gold should also note that $1,700 gold will be viewed as an immense buying opportunity by many and that itself will likely push it back into the $1,800 domain.”
“Also, while those long gold may be aghast now at the notion of $1,700 pricing, they should remember that’s exactly where it was in July before the run-up that took it to $2,000 and above by early August. So, gold can return to $1,700 levels but it’s likely that it will not stay there too long.”
Gold chartist Guillermo Alcala, who blogs on FX Live, concurs with Dixit that a near-term low of $1,700 is a distinct possibility for gold.
In a posting Monday, Alcala said:
"Next areas of interest would be $1,795 (mid-July lows) and $1,760, the 50% Fibonacci Retracement of the March – July rally.”

But Gold Will Also Likely Return To $1,800 “Very Quickly”
Phillip Streible, chief market strategist at Blue Line Futures, does not anticipate a drop of more than $15 beneath the $1,800 level. He explains:
“The $1,850 support had held so many times that it had to break. That said, the lowest it will go, I think, will be $1,785. I expect people to be clamoring to get back in at that point. Those who’ve been rotating out of gold and into bitcoin and what-not will be foolish not to buy gold at those levels.”
Craig Erlam, analyst at OANDA in New York, also sees gold being tested below $1,800 and rebounding from there “very quickly”.
Erlam adds:
“I'm still not convinced we've seen the end of gold's ascent, with plenty more stimulus still on the horizon. The Federal Reserve and European Central Bank are likely to unleash more in December in response to the latest COVID surge and, in the case of the former, delayed agreement on fiscal support. That should also come, all of which could give gold its spark back.”
Logically, gold can rally for two reasons—fear of more COVID-19 enforced lockdowns that can cripple the economy, or runaway stimulus spending to fix the pandemic-hit economy. As we see additional progress with the potential vaccines, the chance of shutdowns look more remote.
But chances are still there for a large U.S. COVID-19 stimulus—similar to the one approved in March which helped form the base for $2,000 gold.
For context, Democrats, who control the House, reached agreement in March with the Trump administration and Senate Republicans to pass the Coronavirus Aid, Relief and Economic Security (CARES) stimulus. That package dispensed roughly $3 trillion as paycheck protection for workers, loans and grants for businesses and other personal aid for qualifying citizens and residents.
Since then, the two sides have been locked in a stalemate on a successive relief plan to CARES. The dispute has basically been over the size of the next stimulus as thousands of Americans, particularly those in the airlines sector, risked losing their jobs without further aid.
But now that Biden’s transition is finally going ahead, there seems to be increased hope that Senate Republicans and the outgoing Trump administration will work with Democrats in the House and the incoming Biden government to get a new bipartisan fiscal package going.
Also, if the Democrats win the two run-off races for the Senate in Georgia on Jan. 5, it will give the party control of both chambers of Congress as well as the White House, which will allow Biden to pass any type of fiscal relief that he deems fit.
Investing.com’s own Daily Technical Indicator for spot gold suggests a “Strong Sell,” with Fibonacci support first at $1,819.46 and later at $1,801.94.
Should the trend suddenly reverse into the positive, then bullion will likely find Fibonacci resistance first at $1,865.33, then $1,876.16, before full-scale selling pressure that mounts at $1,893.68.
As with all projections, we urge you to follow the calls but temper them with fundamentals—and moderation—whenever possible.
Good luck.
Disclaimer: Barani Krishnan uses a range of views outside his own to bring diversity to his analysis of any market. He does not own or hold a position in the commodities or securities he writes about.
