- There was nothing at all surprising about the Fed leaning against the exuberance of the market last week
- The Fed's target of a 2% inflation rate remains very far-fetched
- In the meantime, higher inflation and higher interest rates will contribute to a sharply larger deficit next year
Last week, I only gave you half of the story — and it turned out to be the wrong half.
I expressed the opinion that CPI would probably come in a little hot, the markets wouldn’t react well, and the Fed would talk soothingly about inflation while proceeding with their 50bps hiking plan.
I didn’t talk about the obverse because I didn’t think it was terribly likely: CPI was weak, the markets rallied, and the Fed had to speak sternly instead of soothingly. It’s classic ‘open mouth operations,’ and to be honest, it’s a good reason that you should listen to the Fed but not act on what the Fed is saying.
After many years of being a Fed watcher, a strategist, a trader, and an investor, a lot of this becomes internalized. It’s a good reason to write articles for public consumption, actually, because it keeps me from being shocked by the market reaction to something that seemed very predictable.
Last week was a delightful case in point: while the inflation figure was slightly weaker than expected, the Fed raised overnight interest rates by 50bps as everyone universally anticipated. So far, so good. The formal statement was almost exactly unchanged. The ‘dot plot,’ as expected, shifted higher along the lines of what Fed speakers have been saying. But in Chairman Powell’s post-meeting presser, the accompanying message was quite hawkish.
Powell articulated that “it will take substantially more evidence to give confidence that inflation is on a sustained downward path.” He also repeated the line that will become his epitaph, “[w]e will stay the course until the job is done.” Whatever that means.
The market reaction was swift and severe and actually began with the dot plot’s release. Stocks had been trading cheerfully higher on the day, but at 2:00 pm, the S&P 500 almost immediately trimmed 1.5%-2% from quotes. Thursday saw another 100 S&P 500 points. Friday, another 44.
What in the world caused that reaction? The Fed hiked as expected, and since they wouldn’t want the market to blast off “because inflation is under control and the end of the hikes are near,” they coupled that action with a hawkish message.
Yes, my dear, you may have the car keys – but you’d better drive safely, and if I smell beer on your breath, you’re going to be in deep trouble.
It was obvious they were going to do that, right? Evidently, some inexperienced investors may not have expected that shift in tone. Or maybe it’s the algos. Either way, there was nothing at all surprising about the Fed leaning against the exuberance of the market. It’s the standard operating procedure of the FOMC. Powell even said as much in his statement that opened the presser:
“Over the course of the year, financial conditions have tightened significantly in response to our policy actions. Financial conditions fluctuate in the short term in response to many factors, but it is important that over time they reflect the policy restraint we are putting in place to return inflation to 2 percent.”
Had inflation on Tuesday been hot, leading to a serious selloff, then the Fed wouldn’t have needed to sound as strident; in fact, they probably would have soft-pedaled the message a little. But with markets on the highs and the risk that the Fed might be putting the punch bowl right back out and kicking off a rollicking rally, they had to sound stern. Fear not, though: now that equities are trading lower, Fed speakers over the next week or two will administer the soft touch and express their confidence in the trajectory of inflation.
To be sure, higher interest rates further out the yield curve and lower equity prices make eminent sense anyway. While we are heading into a recession with very high confidence, inflation is likely to remain sticky, and consequently, long rates shouldn’t be trying to price in the next 300bp easing cycle yet.
Moreover, I’m concerned that the higher inflation and the higher interest rates will contribute to a sharply larger deficit next year (higher Social Security payments resulting from higher inflation and higher interest rates paid on Treasury debt being rolled over), and the Fed is selling instead of buying. I am not sure who is going to be buying those trillions.
Taking a Step Back
This is the final ‘Weekly Inflation Outlook.’ I will continue to produce articles on my blog and podcasts, and Investing.com will continue to carry many of those media.
But let me take one more step back.
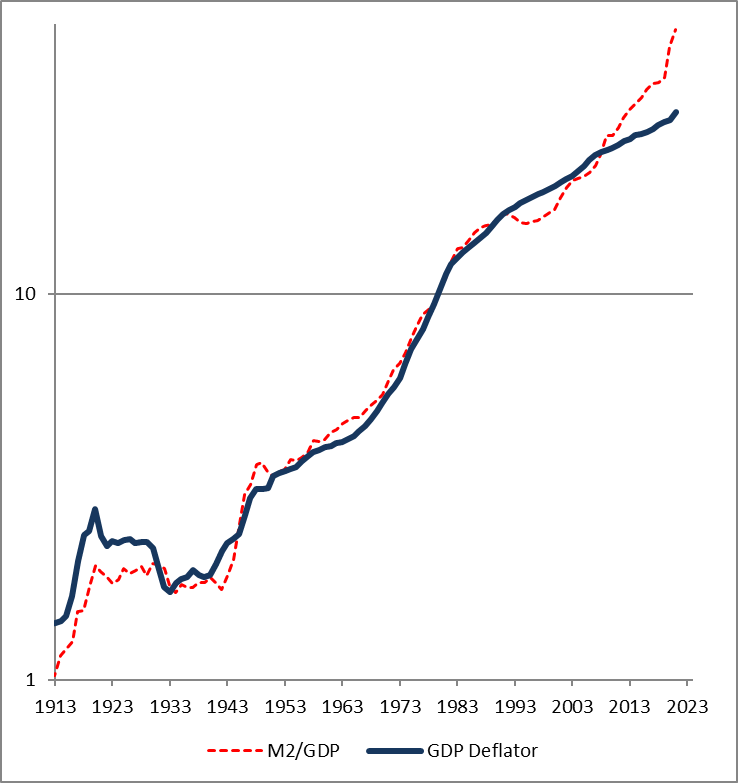
We have just finished an unprecedented period of money growth. Historically, high money growth always – not sometimes, but always – leads to high inflation. Moreover, an increase in the GDP-adjusted money supply of X% generally produces an increase in the price level of X% (see chart, source Federal Reserve with Enduring Investments calculations). Since the end of 2019, M2/GDP has increased by 34%.
The GDP Deflator has increased by 13.5%. Unless there has been a permanent impairment of money velocity, this means there is ‘potential energy’ that will mean higher-than-equilibrium inflation going forward for a few years.

What do markets say? 10-year inflation breakevens (10-year Treasury yields minus 10-year TIPS yields) are at 2.15%, indicating that an investor who chooses between nominal 10-year Treasuries and TIPS should choose the latter unless he/she thinks inflation will be below 2.15%, compounded, over the next decade.
And what does history say?
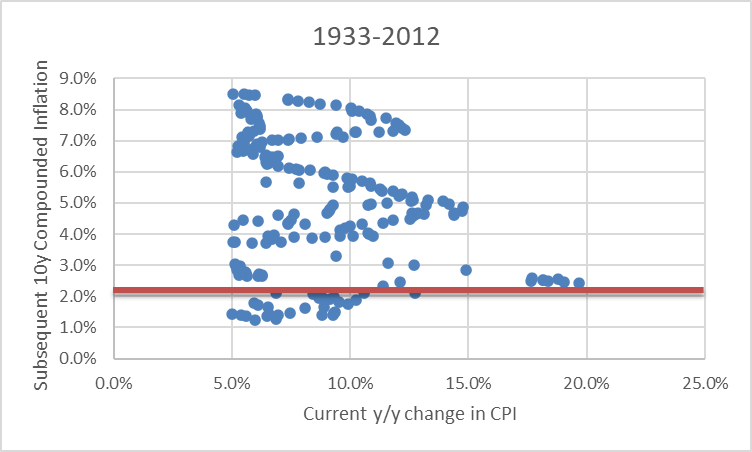
Since 1933, the median year/year increase in CPI has been 3.00%. The median 10-year compounded inflation outcome has been 2.99%. However, this changes if you condition the observation on the starting point. Over that 90-year period, if year/year inflation was over 5% then the median of the subsequent 10-year compounded inflation outcome was 5.06%.
Only one-eighth of those periods ended up at 2.15% or below, looking back from a decade later. The chart below shows those periods where y/y inflation at the beginning of the decade was over 5%. The y-axis shows the subsequent compounded 10-year outcome. The red line is drawn at the current level of 10-year inflation breakevens.

Source: BLS, Enduring Investments calculations
The conclusion I draw is that if you step back and take a look with the benefit of the hindsight of history, expecting inflation to come in at 2.15% or below — or, even, to come in very close to 2.15%...is pretty heroic.
***
Disclosure: My company and/or funds and accounts we manage have positions in inflation-indexed bonds and various commodity and financial futures products and ETFs, that may be mentioned from time to time in this column.
Which stock should you buy in your very next trade?
With valuations skyrocketing in 2024, many investors are uneasy putting more money into stocks. Unsure where to invest next? Get access to our proven portfolios and discover high-potential opportunities.
In 2024 alone, ProPicks AI identified 2 stocks that surged over 150%, 4 additional stocks that leaped over 30%, and 3 more that climbed over 25%. That's an impressive track record.
With portfolios tailored for Dow stocks, S&P stocks, Tech stocks, and Mid Cap stocks, you can explore various wealth-building strategies.
