- Geopolitical tensions roil global markets as focus shifts to Middle East.
- Oil prices surge amidst escalating risks.
- Gold, dollar also rebound amidst rising safe haven demand
Global markets are kicking off the week with heightened volatility, fueled by escalating tensions between Israel and Palestine, which have now reached a level of official war.
Should tensions in the Middle East continue to escalate, it's likely that markets will factor in geopolitical risk throughout the week. This could temporarily overshadow the week's significant economic developments.
These geopolitical challenges add to an already eventful week for global markets. Notably, the US CPI data release has gained even more importance following last week's surprising employment figures.
Additionally, this week will see the release of the latest FOMC meeting minutes. However, the impact may be limited if they contain no new information beyond the previously stated rhetoric.
In contrast, the interplay of inflation data and geopolitical tensions is expected to exert significant influence on the Federal Reserve's forthcoming interest rate decision.Looking at the latest outlook of the dollar index, it was seen that DXY moved indecisively on the last day of last week.
Dollar Index Fights Back on Increased Safe Haven Demand
The US dollar index initiated the new week with an upswing, and from a technical standpoint, it's evident that the 106.6 resistance level is once again in focus. A breakthrough beyond this point, especially if bolstered by positive economic data, could potentially set the stage for the next peak in the 108 range.
On the downside, the 106.4 level stands as the nearest support, with the 105.8 level serving as a more substantial support before reaching the critical 105 support level.
Conversely, there is a possibility of a waning bullish momentum for the DXY, which has recently centered around an average of 106.5, contingent upon a resurgence in demand for gold in the upcoming days.
Oil Also on the Rise Due to Geopolitical Tensions
Shifting our focus, prevailing risks have spurred a significant uptick in oil prices. This development has the potential to stoke concerns about rising energy costs, a pivotal factor in inflationary worries. A sustained upward trajectory in oil prices may prompt fears of a less optimistic inflation outlook in the coming months. Consequently, the Federal Reserve is likely to maintain a vigilant stance, closely monitoring elements that could drive up energy expenses, in addition to this week's inflation data.
Following last week's mixed employment data, there is a growing likelihood that expectations of a 25 basis point interest rate hike by year-end may gain further momentum.
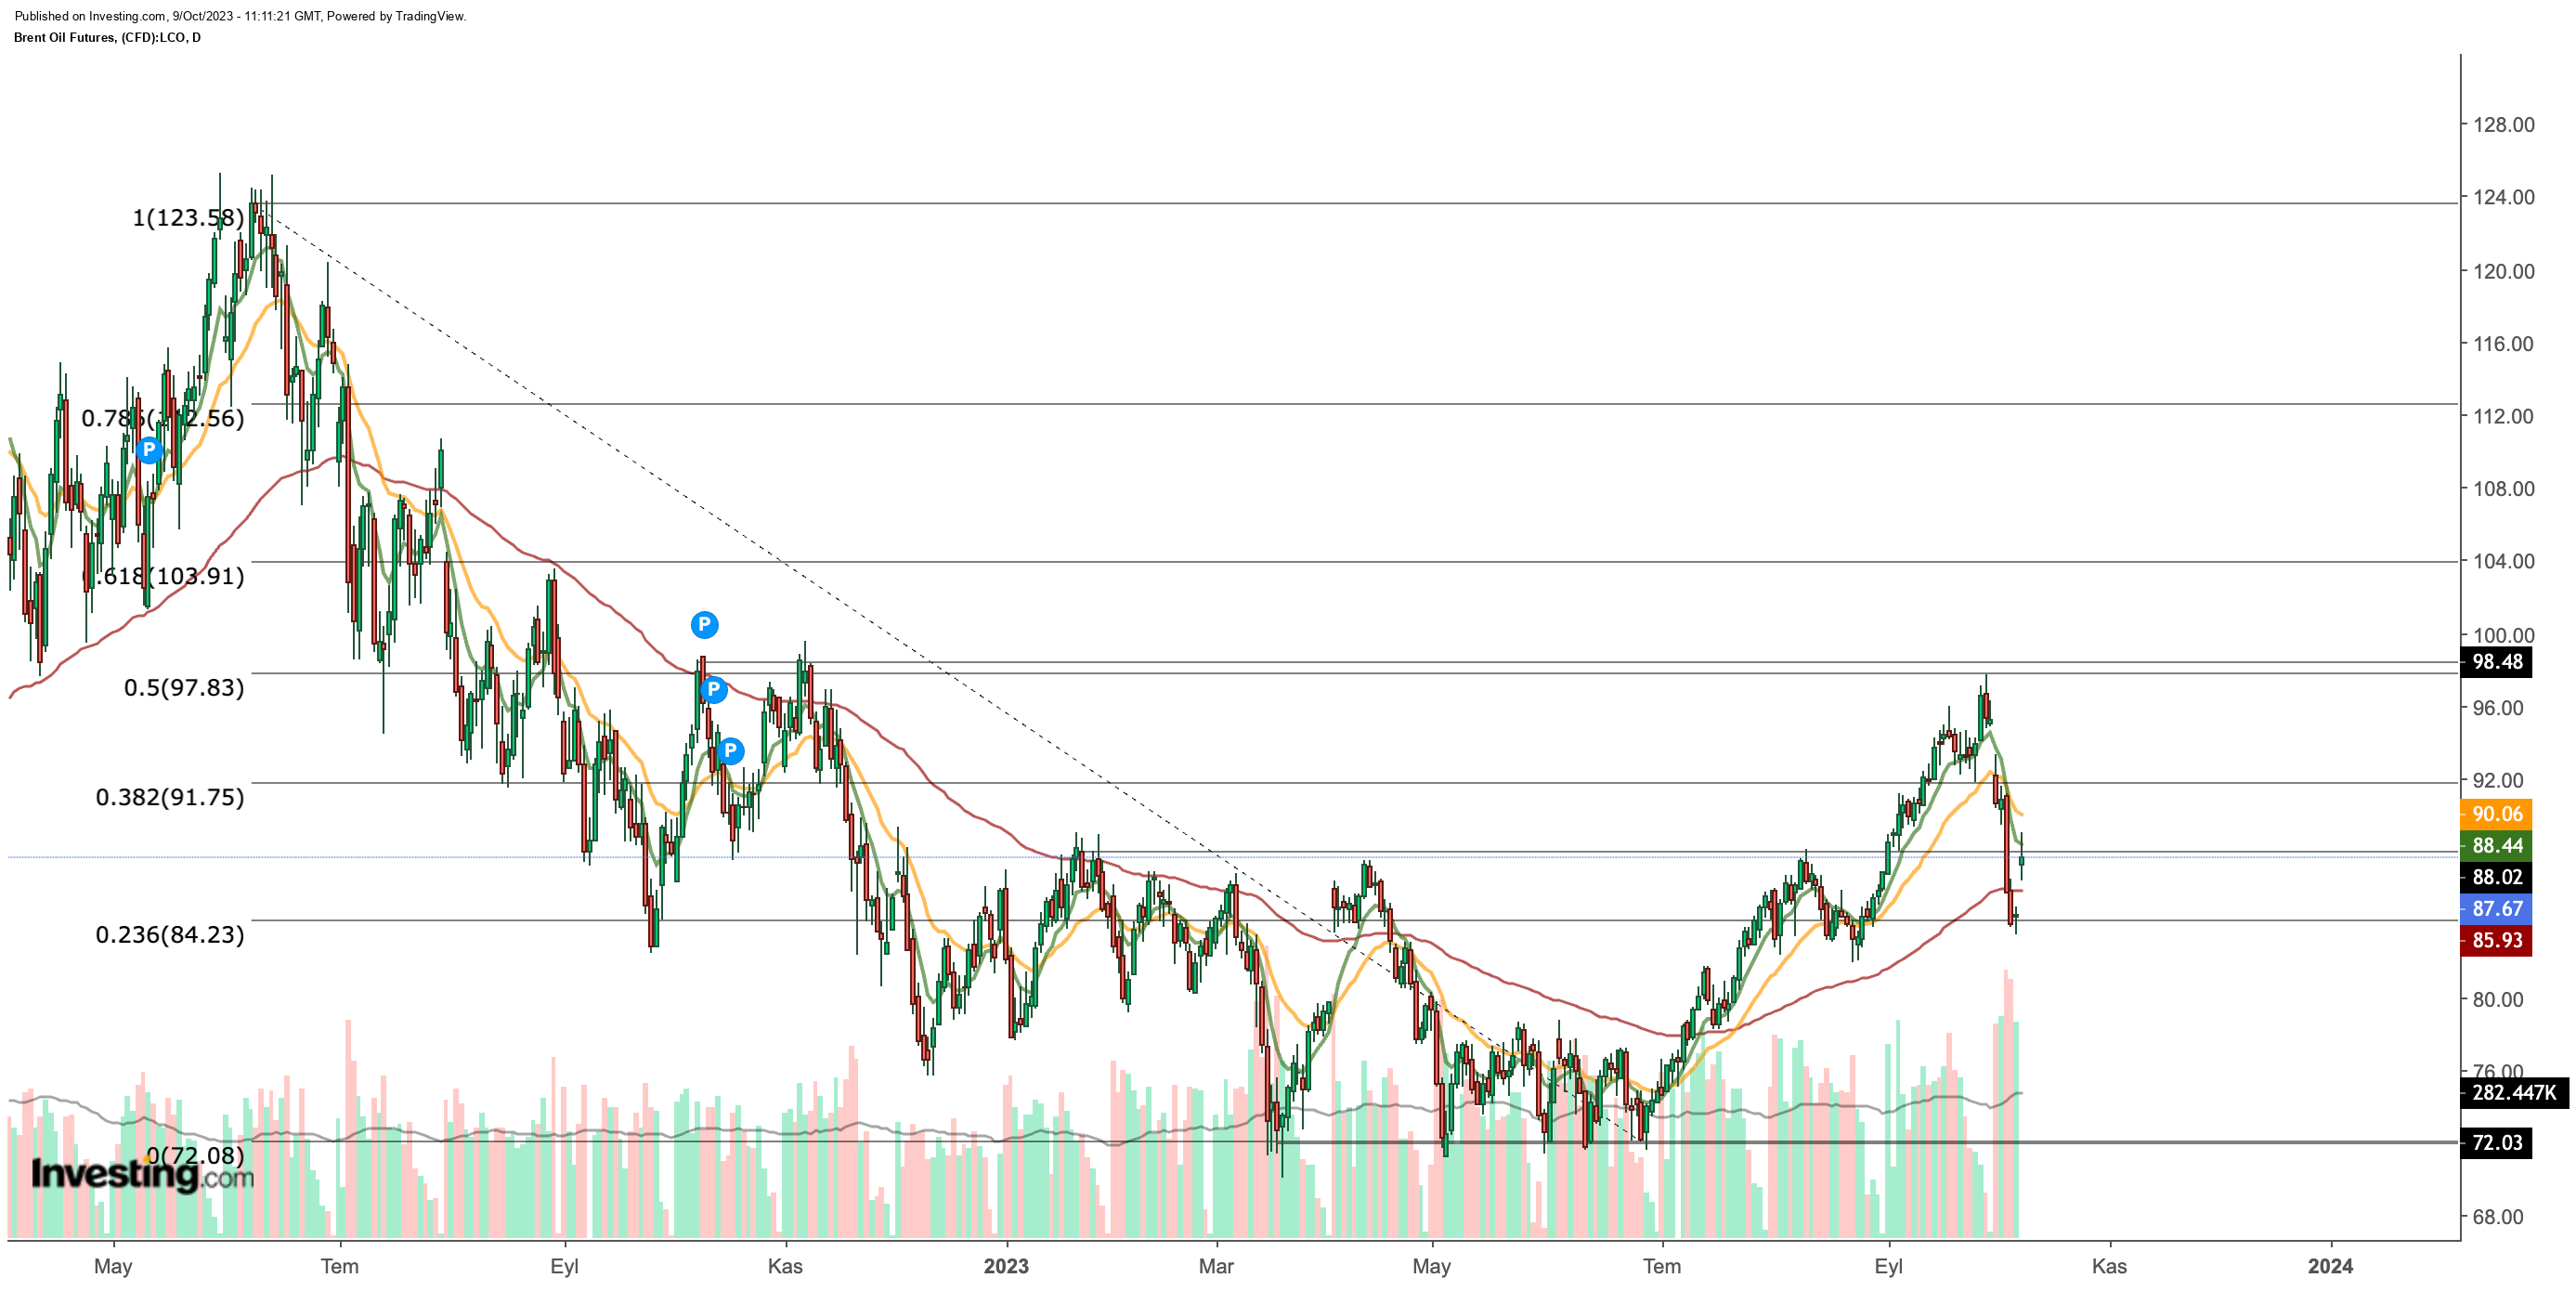
 After multiple tests of its Q2 lows of around $72, Brent crude oil gathered momentum towards $95 by late September, driven by supply cut decisions by Russia and the Arab Emirates.
Despite a notable correction in October, oil prices closed at $83 last week. But after starting this week with a significant 5% gap due to the Israel-Palestine clashes over the weekend, Brent oil is now testing the $88 resistance level, previously encountered in Q1 of this year.
The escalating tensions in the region are likely to act as a catalyst for further oil price increases, potentially propelling it into the $90 range initially. Subsequently, the upward momentum could persist, aiming for the $100 threshold.
Market sentiment favoring ongoing monetary tightening will likely continue to push U.S. bond yields upward, maintaining the strength of the dollar in the final quarter of the year. An offsetting factor that could mitigate this impact is a potential resurgence in demand for gold.
Gold Tries Oversold Bounce

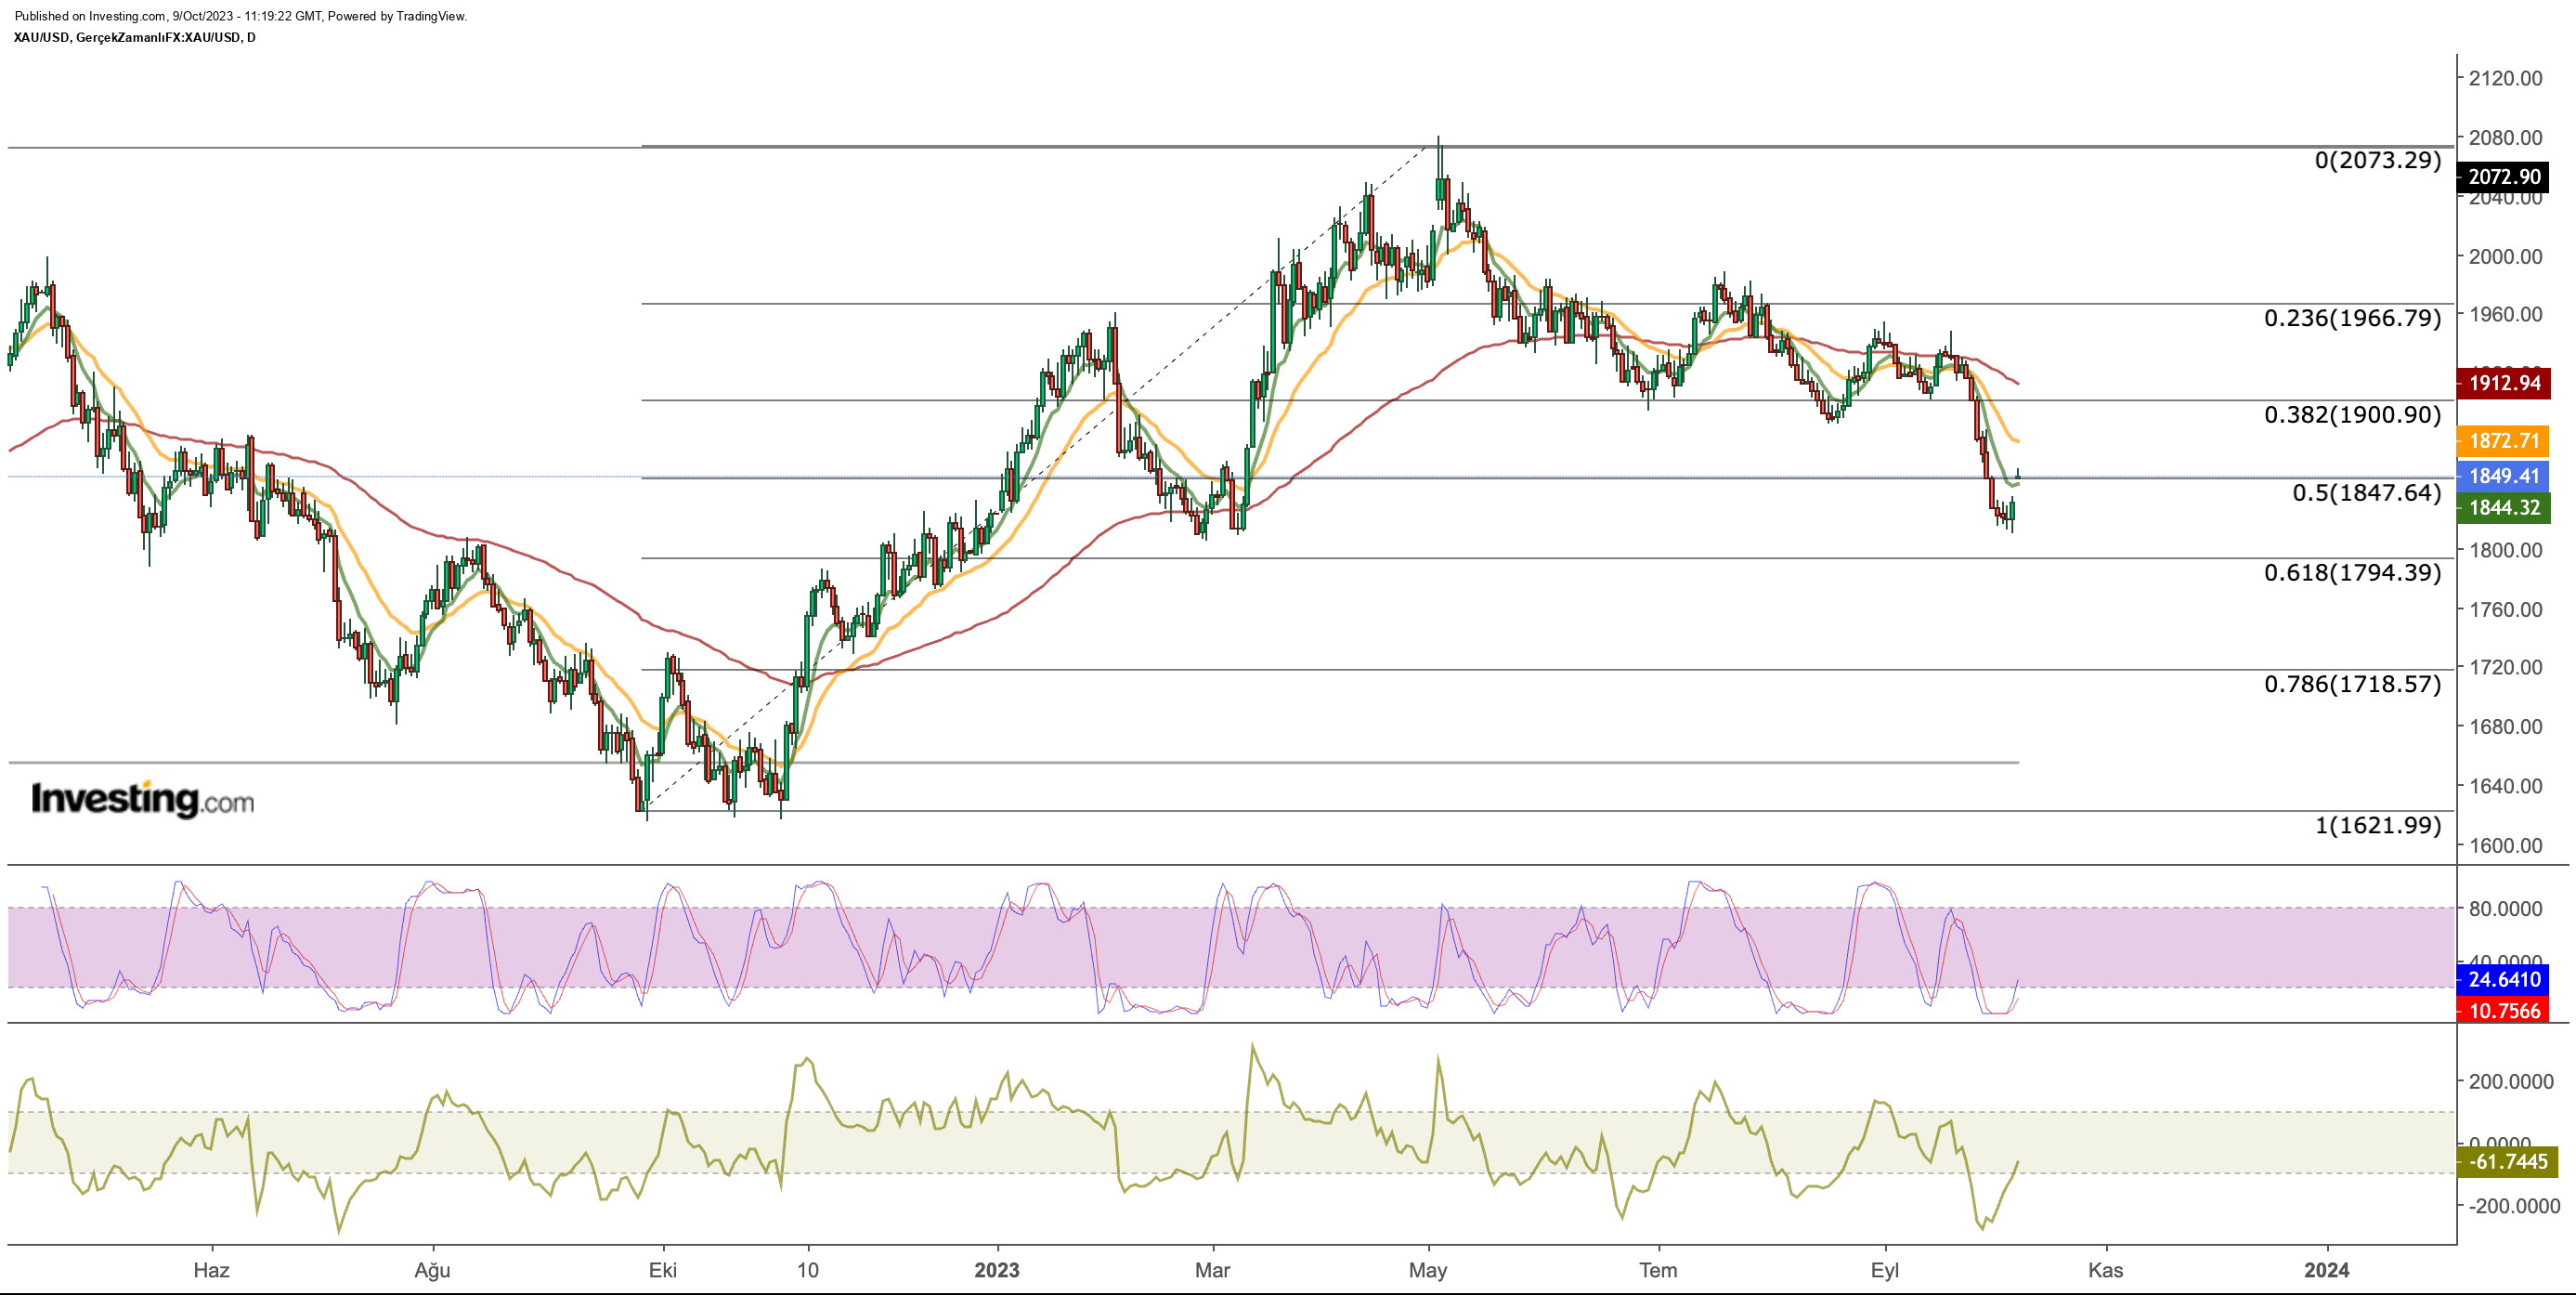
After breaking through the $1,900 support level in the latter half of the year, gold accelerated its descent, reaching an ideal correction level at approximately $1,810, as per the Fibonacci 0.618 retracement.
In tandem with the rise in risk perception leading to increased demand for commodities, the gold market witnessed a gap-up opening. The price per ounce of gold commenced the week with a 1% gain, hovering around the $1,850 mark. Should this demand persist, the $1,870 range will emerge as the initial resistance zone, followed by the critical juncture at the $1,900 mark, which will determine the trend for gold.
The gold market has faced pressure in recent months due to heightened demand for the dollar in a climate of global uncertainty. However, the resurgence of geopolitical risks could potentially reverse this trend. Such a development might rekindle demand for gold in the final quarter, diminishing the allure of the currently overbought dollar.
Consequently, it's conceivable that the pricing dynamics of this week may be driven more by geopolitical risk than economic data, which could exert a more pronounced influence in the forthcoming periods.
***
Disclosure: The author holds no positions in the securities mentioned in this report.

