- The US dollar has continued its decline, reaching a two-month low at 103.6, driven by expectations of a Fed pause in rate hikes and potential future cuts.
- DXY faces technical challenges as it approaches the 102.5 - 103 support zone, with short-term moving averages signaling a likely continuation of the decline.
- Meanwhile, the euro has strengthened against the dollar on expectations of earlier Fed rate cuts, reaching a critical resistance point.
- Secure your Black Friday gains with InvestingPro's up to 55% discount!
After experiencing its sharpest weekly decline since July last week, the US dollar kicked off the new week by sustaining its downward trajectory.
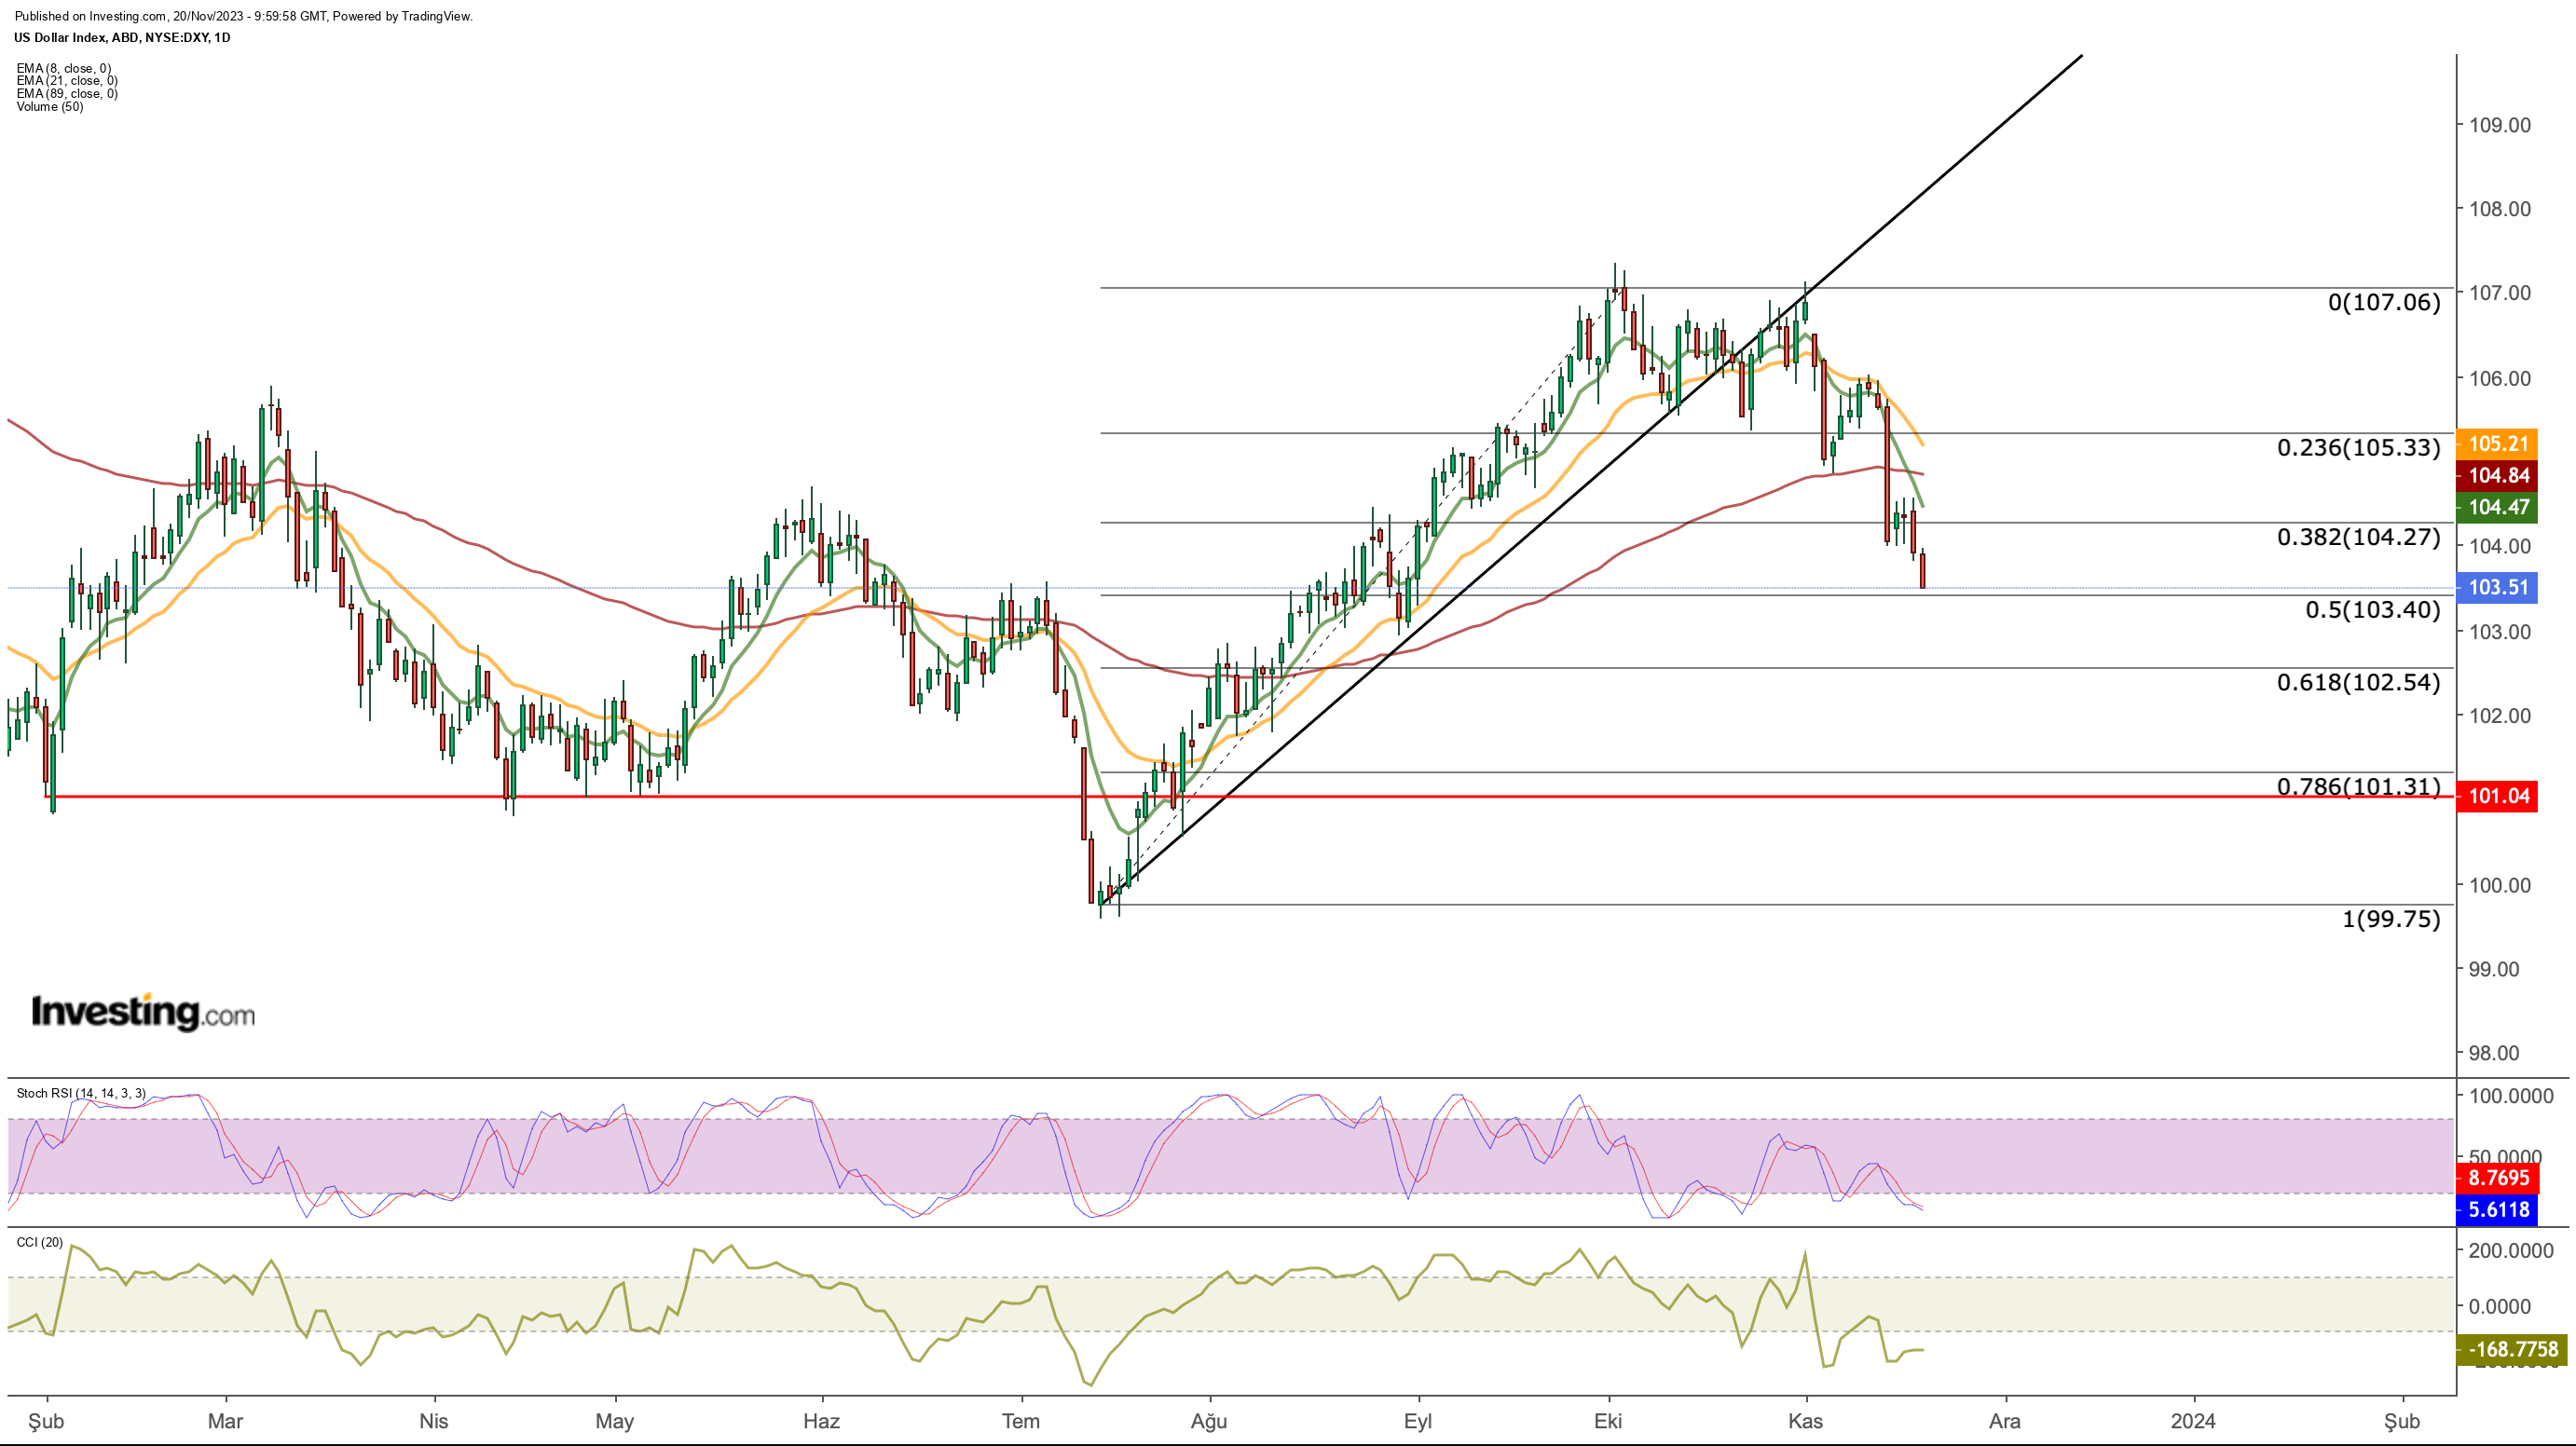
Today, DXY dropped to its lowest level in the last 2 months, reaching as low as 103.6, while concurrently generating bearish signals based on recent economic developments.
Following lower-than-expected inflation data last week, investor sentiment has solidified around the belief that the Fed is done raising rates.
Consequently, the market has shifted its attention to when the Fed might start interest rate cuts.
Despite recent dovish remarks from Fed officials supporting a softer dollar, market pricing does not fully incorporate officials' statements indicating a potential reactivation of tightening policies when necessary.
As the perspective that the Fed will transition to a pivot interest rate phase gains traction, there are still some suggestions that the Fed might start cutting rates sooner, impacting risk appetite.
Simultaneously, tomorrow's release of the minutes from the Fed's last meeting, where interest rates remained unchanged for the second time, is anticipated.
Given the trends from last week, the impact of the meeting minutes on the US dollar is expected to be limited.
DXY, which demonstrated stability in October despite escalating geopolitical issues, has now entered a downward trend due to the increase in risk appetite as regional tensions expand and news flow decelerates.

Technically speaking, the dollar remained horizontal for a month in the September-October period and then entered a correction trend.
The index, which tried to hold on to 105 support for a while, lost its support in the 104.2 band after last week's sharp decline and is moving towards the main support zone in the 102.5 - 103 band while maintaining its negative outlook this week.
This region is likely to be tested this week. A possible breakout could push the index down to 101, the support in the first half of the year.
On the other hand, short-term moving averages continue to signal that the decline may continue as they are in the inverse crossover phase.
On the weekly view, the Stochastic RSI suggests that there is some more room for a decline. In the shorter term, the indicator has started to reflect oversold conditions. It has become important to maintain the intermediate support at 103.4 for a possible reversal.
However, there is currently little data on dollar demand showing that it is spiking. The decision to cut oil supply from the OPEC meeting due to the retreat in oil prices this week may lead to short-term reaction purchases in the dollar.
In the current situation, it seems more likely that the index will continue its correction phase.
Weak demand for the dollar leads to an increase in demand for gold with major currencies that seem more risky.
EUR/USD In this process, it rose up to the 1.09 band. USD/JPY, which retreated sharply due to the weakening in the dollar, fell to the 147 band while starting the week with sellers. Gold, which turned its direction up last week, started the week horizontally.
EUR/USD: Will the Uptrend Continue?
Euro rose against the US dollar last week amid rising expectations that the Fed would start cutting interest rates sooner. In addition, the inflation data released on Friday in the Eurozone fell below 3%, which was another factor supporting the pair.

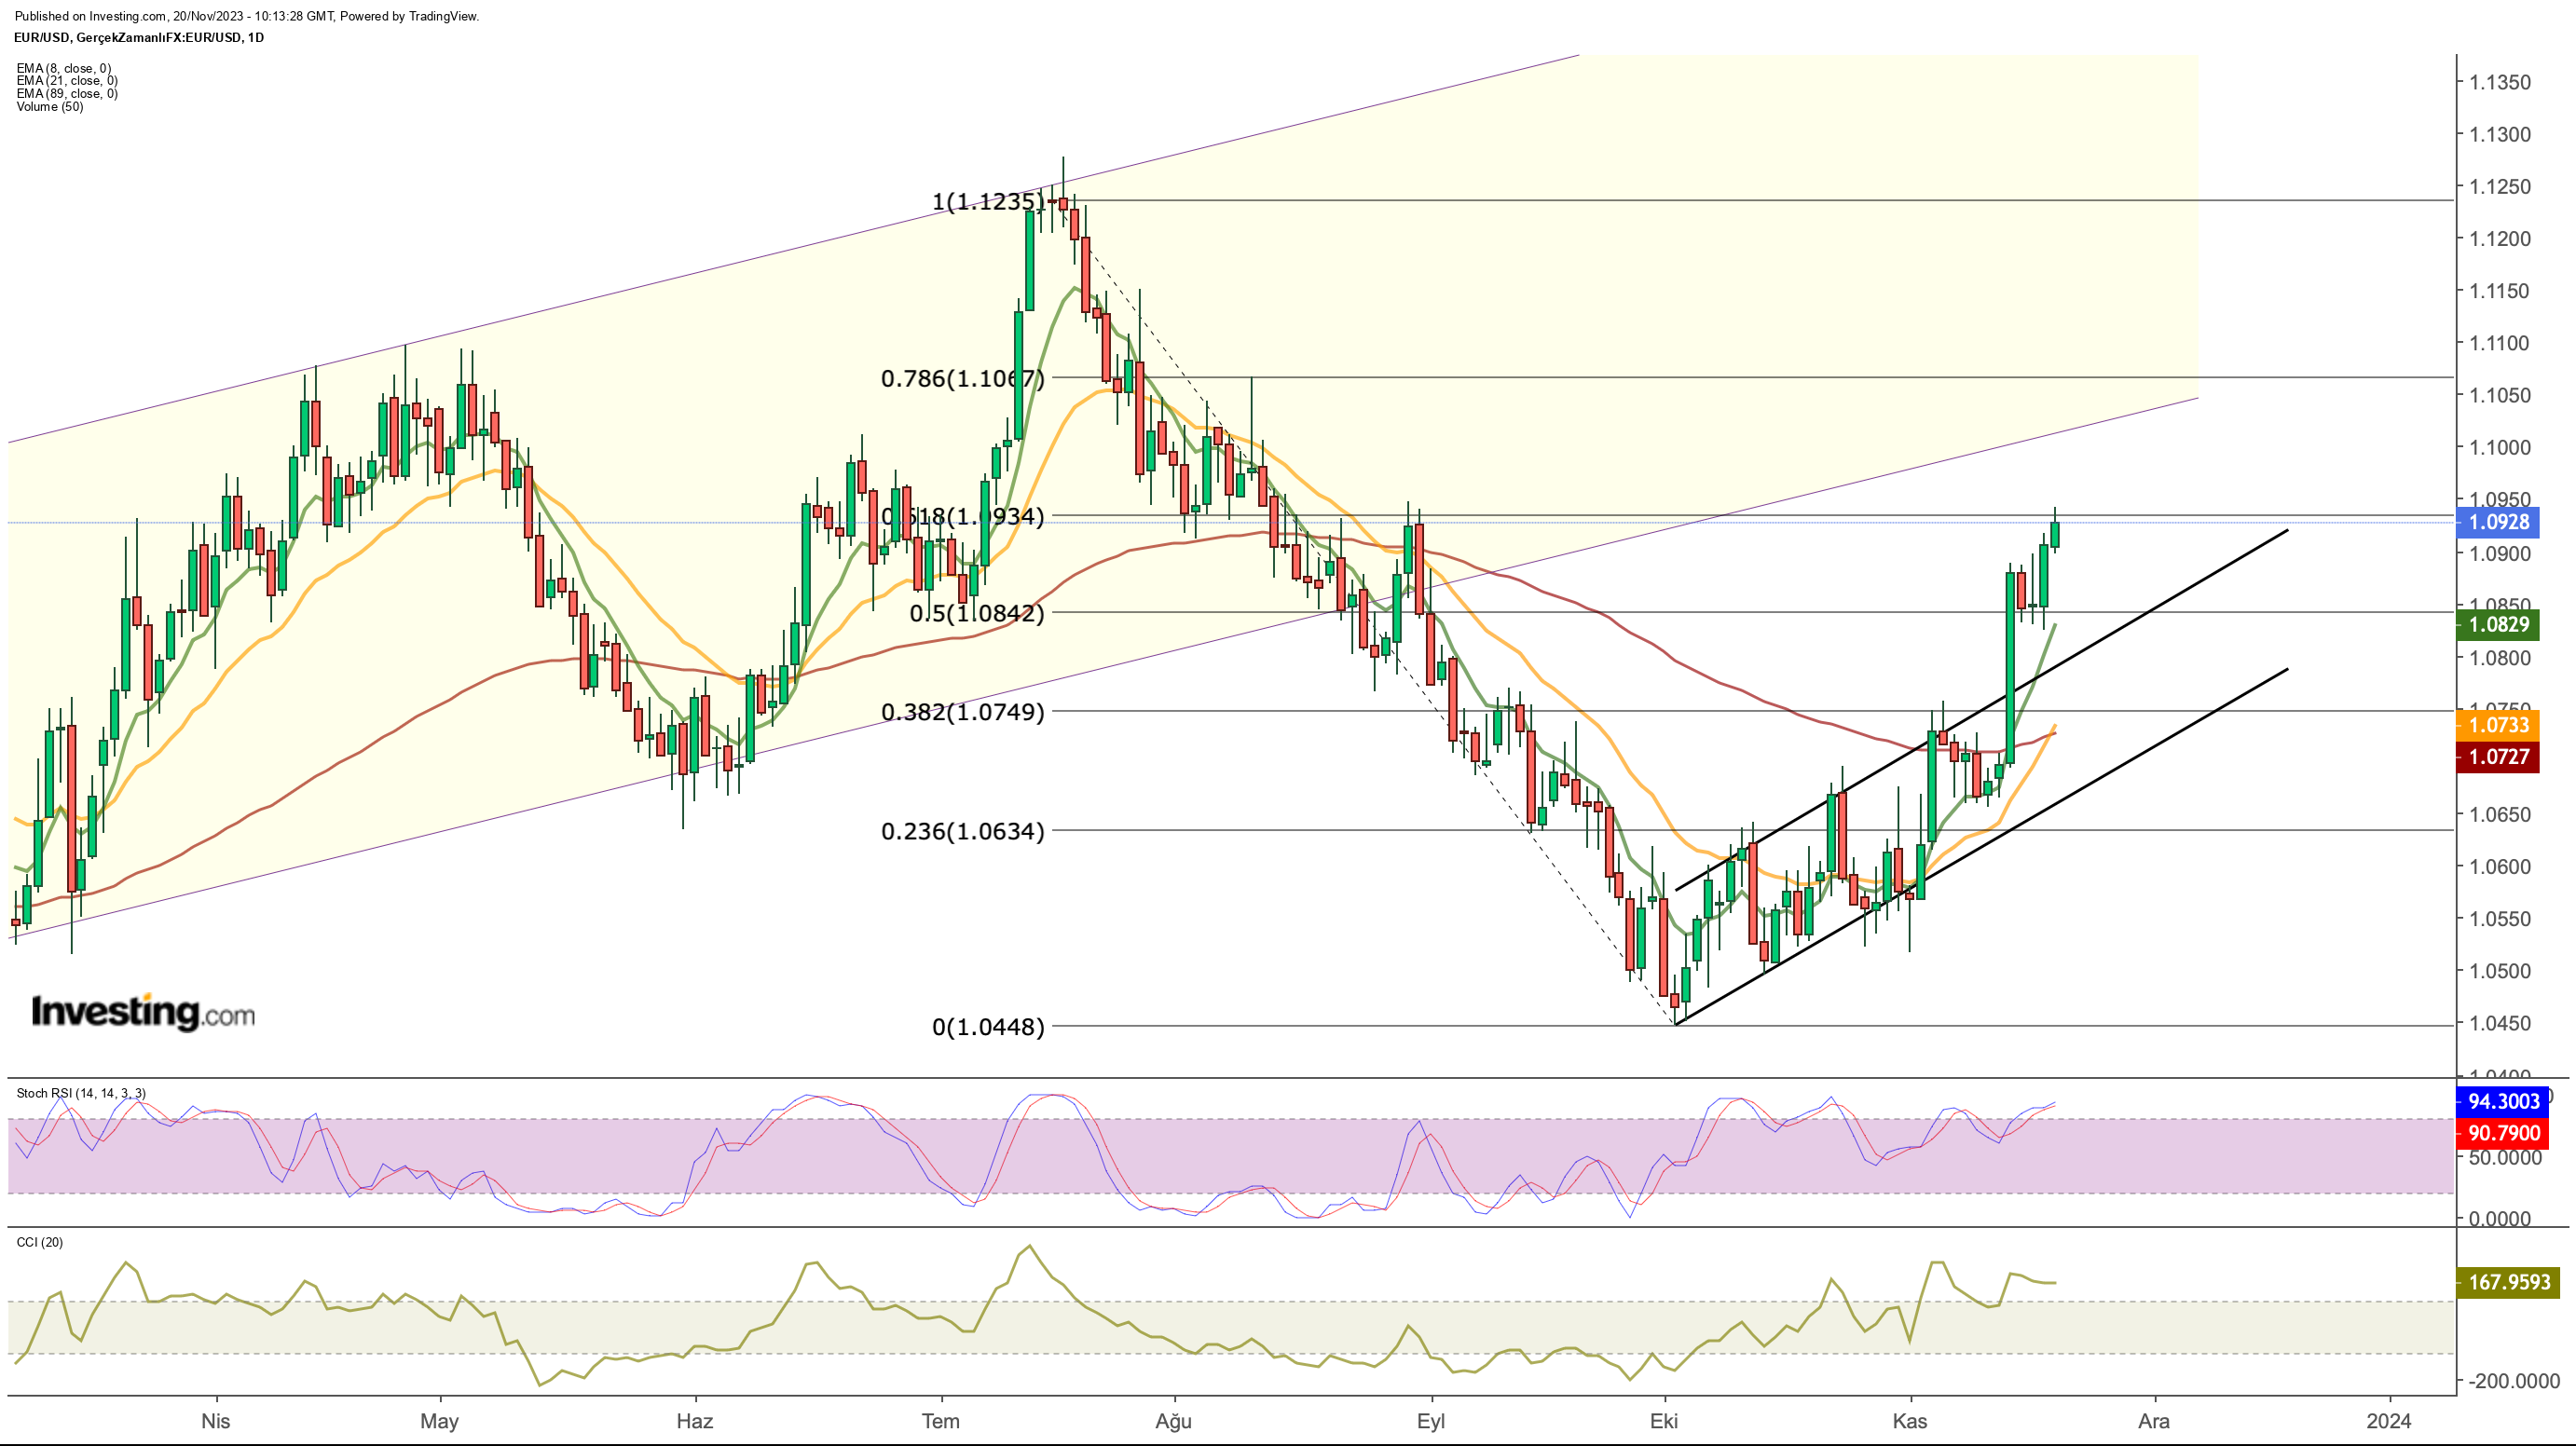
EUR/USD, which made its highest jump on the day the US CPI data was released, thus reached a critical resistance point compared to the last downtrend this week with the price action exceeding the ascending channel.
This week, the Fib 0.618 retracement value at 1.093 becomes important, while the pair is likely to reach its next resistance at 1.1 (Fib 0.786) if this resistance is exceeded. Otherwise, we can see that the euro may loosen up to $ 1.083.
USD/JPY Retreats, Eyes Lower End of the Rising Channel
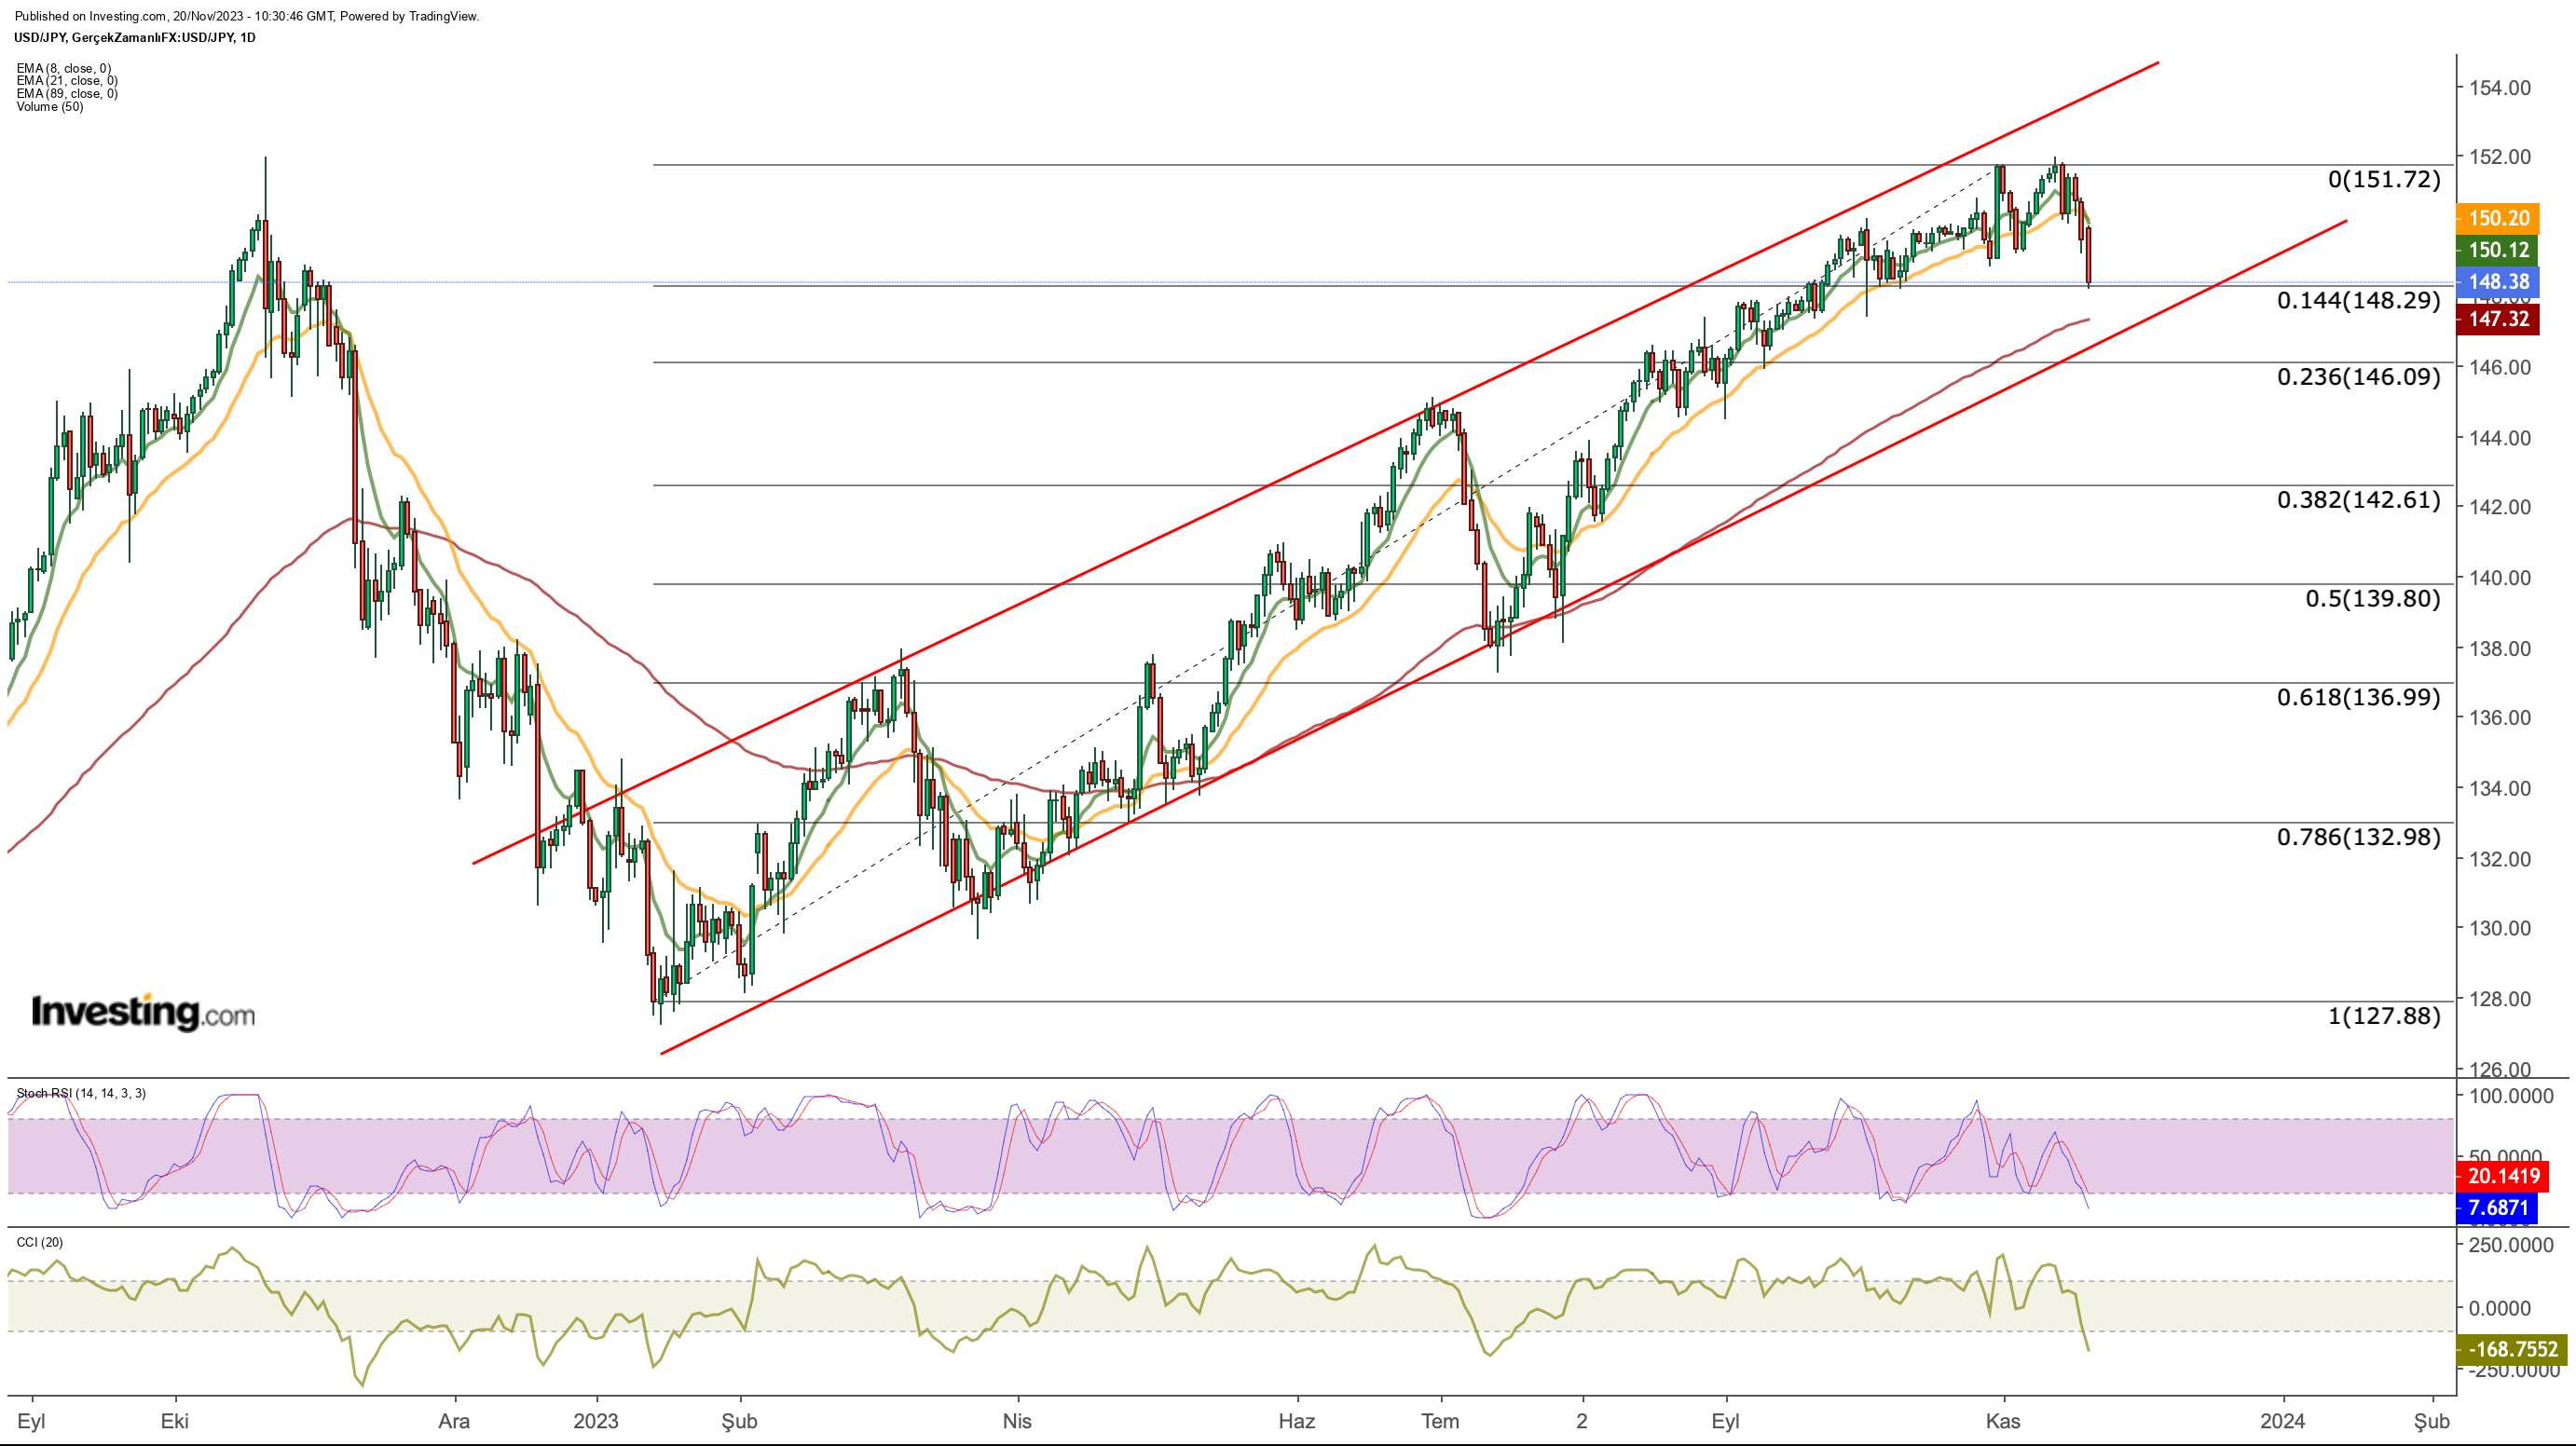
USD/JPY, which has been moving in an ascending channel since the beginning of the year, started to be pressured at 151, the peak of the last year, throughout November. As a result of this pressure, USD/JPY retreated sharply as US data triggered the weakening of the US dollar.

Although the appreciation of the Japanese yen against the dollar has accelerated in recent days, it is seen that the movement continues within the rising channel.
Accordingly, the important price level for a possible trend reversal can be followed as 146. A weekly close below this value could be a trigger for a trend reversal in USD/JPY.
In addition, the 148.3 level tested today came to the agenda as intermediate support in the short term. While daily closes above this value indicate that the pair remains resistant, possible reaction purchases may cause the pair to rise toward the 150 level.
Gold: Yellow (OTC:YELLQ) Metal Could Continue Moving Up
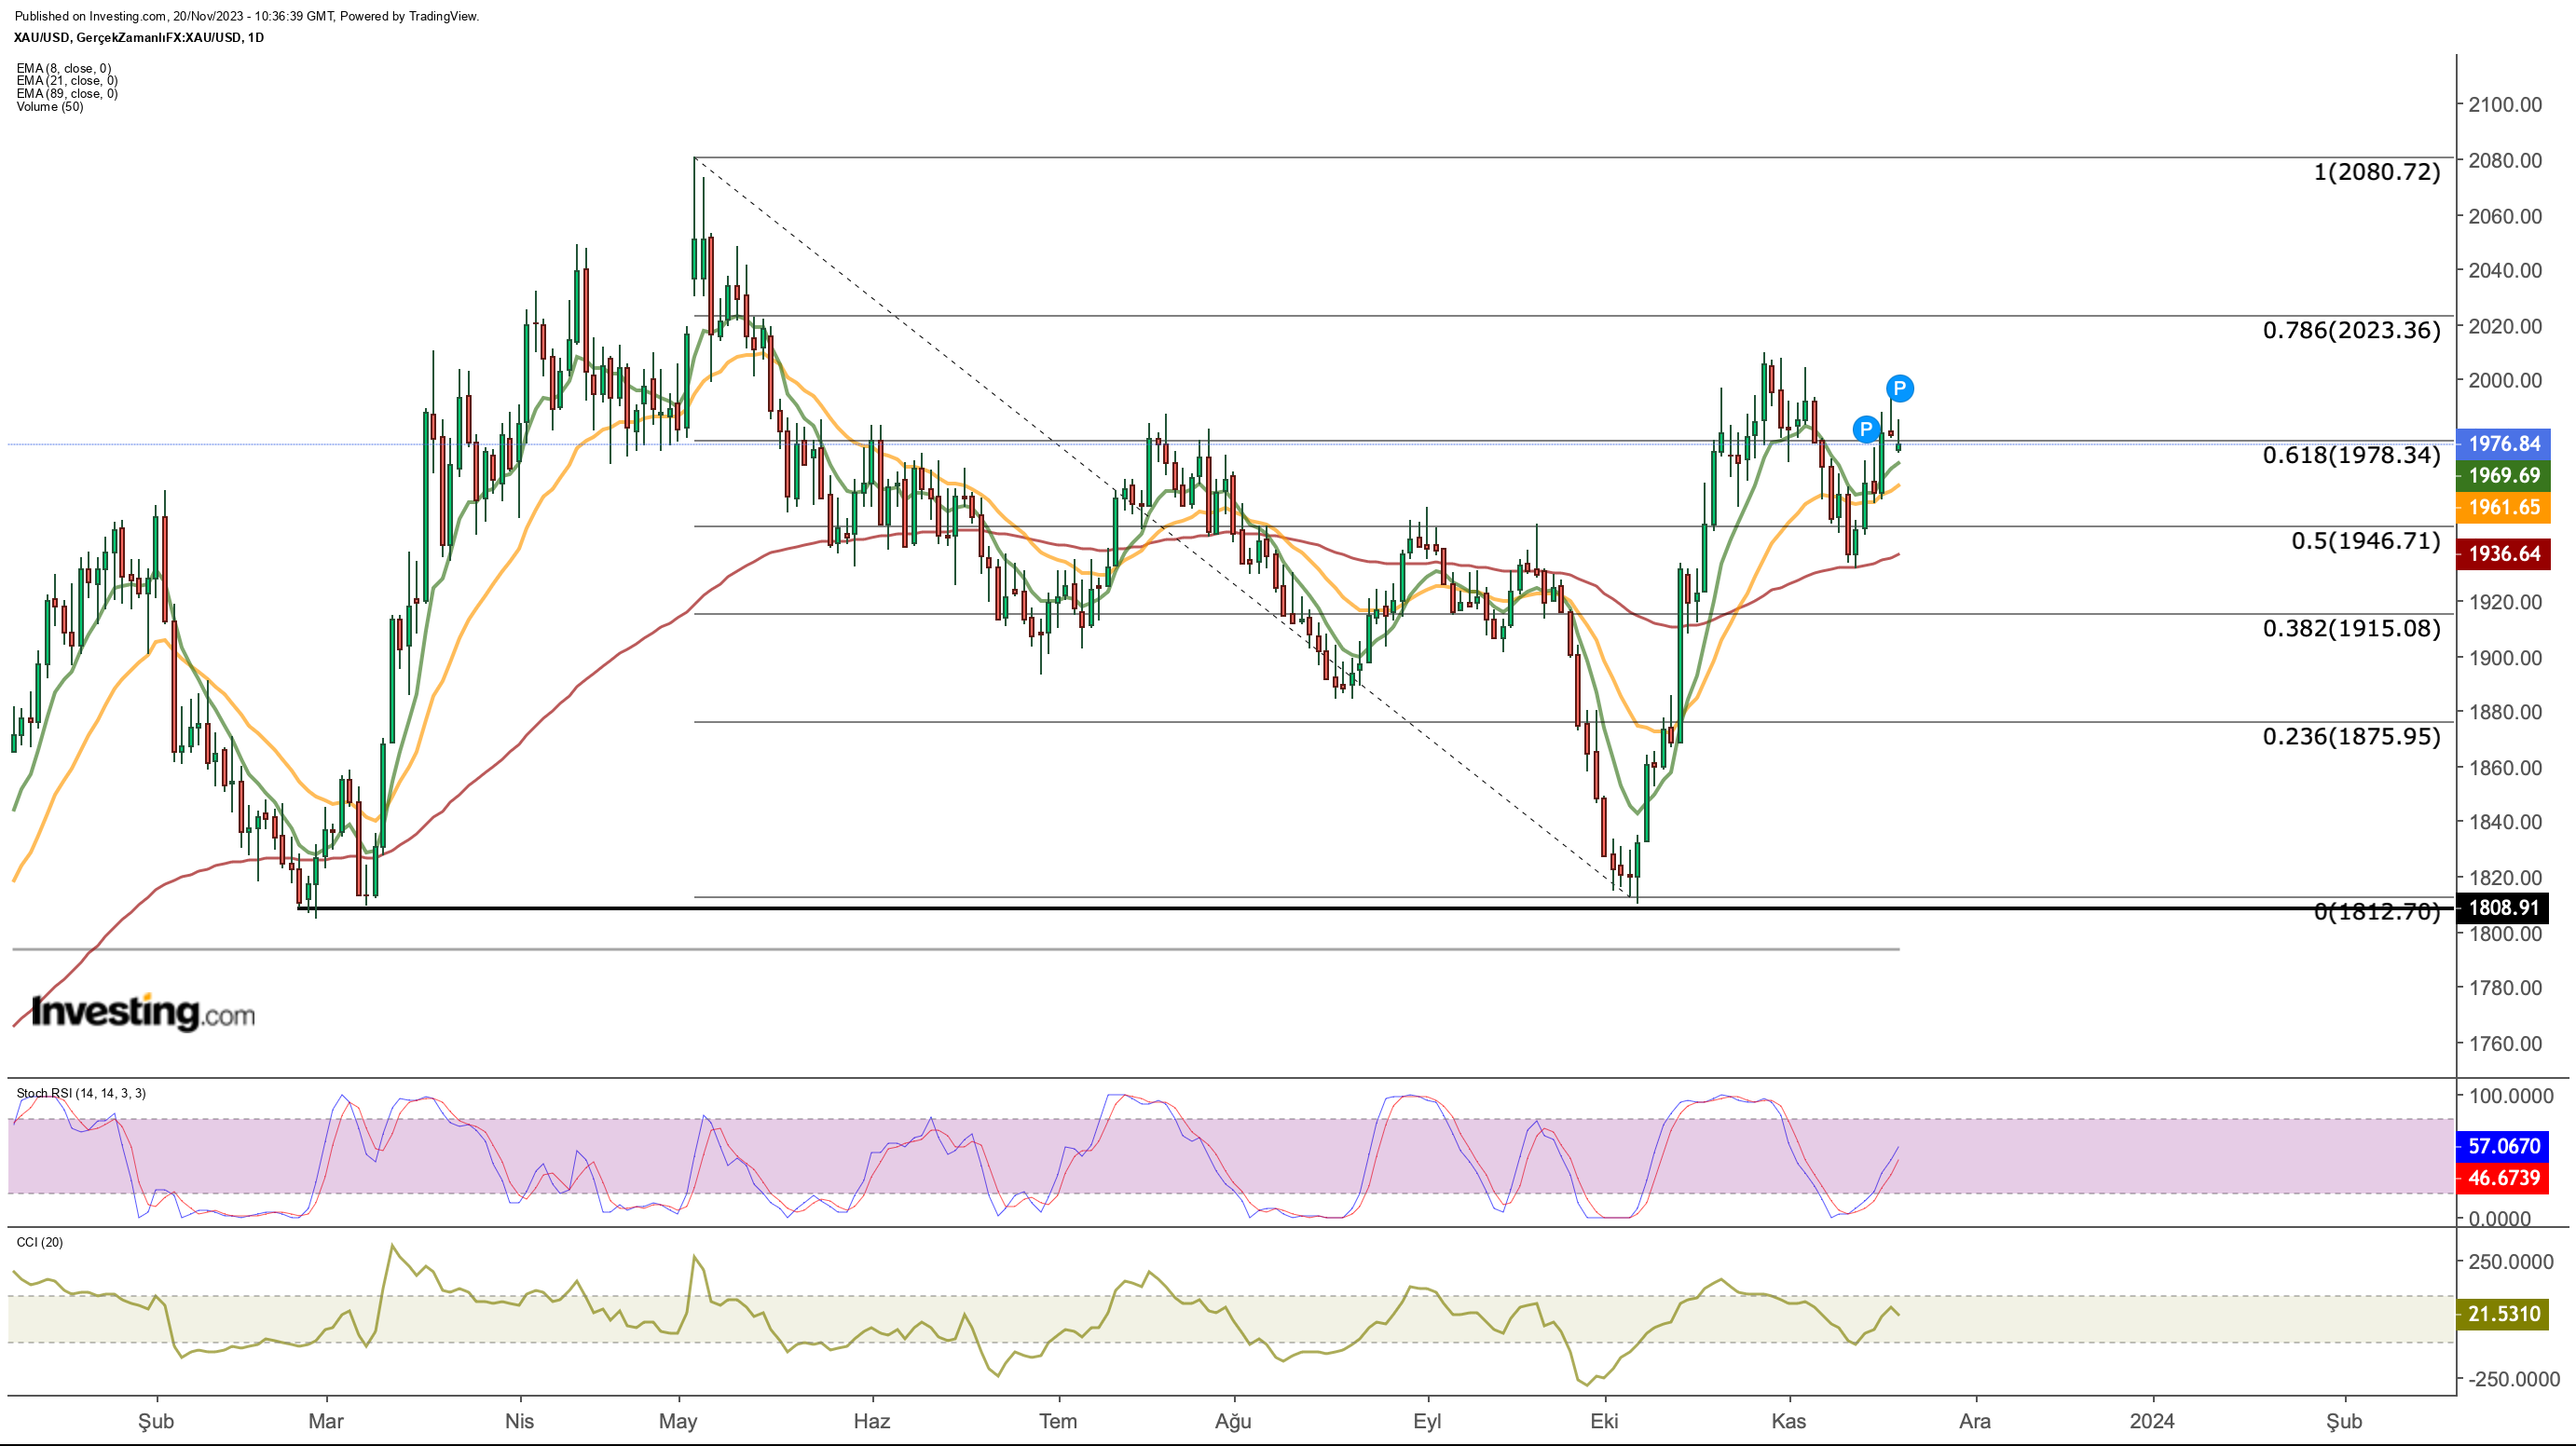
Last week, while the 3-month EMA value found support at $ 1,930, the recovery trend continued up to $ 1,980, which worked as resistance throughout the year.

If the ounce of gold, which had difficulty exceeding this price level at the beginning of the week, can close daily above this resistance price, we can see that the next target price could be the $ 2,020 level.
Currently, technical indicators continue to support the upward momentum in gold. However, for the continuation of the movement, it is very critical to exceed the $ 1,980 zone with a clear daily close.
On the other hand, if this resistance cannot be exceeded, the increase in possible profit sales may lead the gold price to retreat once again to the range of $ 1,930 - $ 1,950.
***
Buy or Sell? Get the answer with InvestingPro for Half of the Price This Black Friday!
Timely insights and informed decisions are the keys to maximizing profit potential. This Black Friday, make the smartest investment decision in the market and save up to 55% on InvestingPro subscription plans.
Whether you're a seasoned trader or just starting your investment journey, this offer is designed to equip you with the wisdom needed for more intelligent and profitable trading.
Disclaimer: This article is written for informational purposes only; it does not constitute a solicitation, offer, advice, or recommendation to invest as such it is not intended to incentivize the purchase of assets in any way. I would like to remind you that any type of asset, is evaluated from multiple points of view and is highly risky and therefore, any investment decision and the associated risk remains with the investor.

