- Markets ended August on a bullish note.
- History suggests September can be a volatile month for stocks.
- However, some indicators suggest that might not be the case this time.
- For less than $8 a month, InvestingPro's Fair Value tool helps you find which stocks to hold and which to dump at the click of a button.
The market wrapped up August on strong footing with the S&P 500 closing near record highs, and the Dow Jones Industrial Average setting a new all-time high
Several key market sectors reached record levels too, indicated by the rise in the following ETFs:
What’s particularly noteworthy is that this strong run came despite the Magnificent 7's worst month relative to the S&P 500 since December 2022. 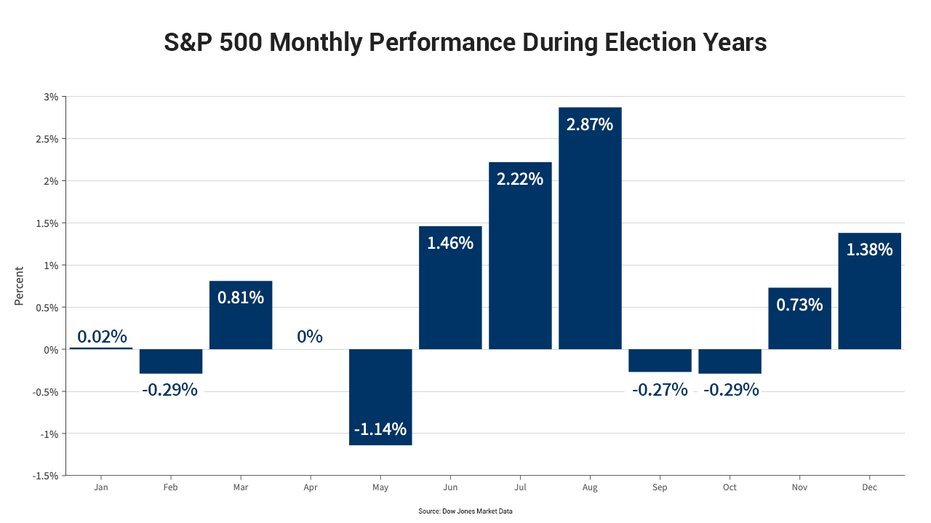
The S&P 500 has marked a record of its widest monthly closes in 8 of the past 9 months, achieving new all-time highs for four consecutive months.
This feat has only been matched seven times since the early 2000s, with previous instances in June 2014, February 2017, July 2017, November 2017, January 2020, May 2021, and March 2024.
Such sustained performance signals a bullish trend. March and August 2024 have both demonstrated exceptionally strong and one of the most robust bullish phases in history.
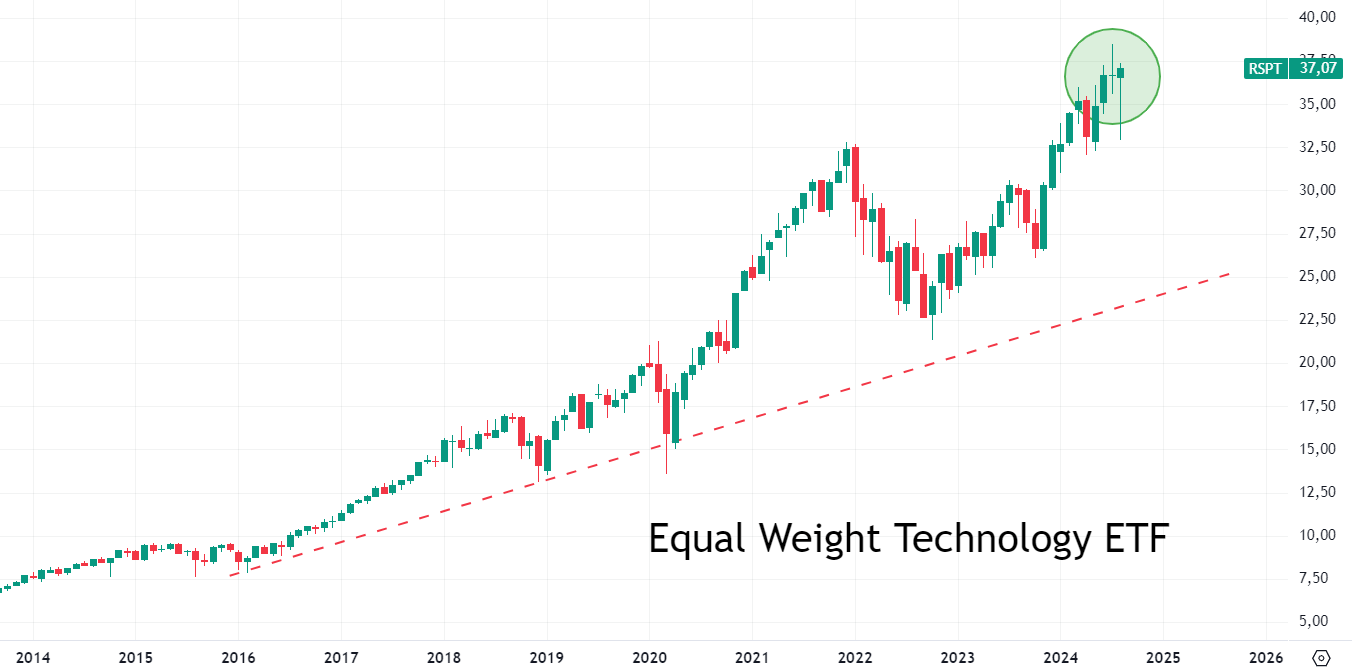
Additionally, the Invesco S&P 500 Equal Weight Technology ETF (NYSE:RSPT) posted a historic monthly close.
What’s Driving the Bull Trend?
They're the same factors that have supported the market in recent months: persistent disinflation, a resilient labor market, positive macroeconomic data, shifts in monetary policy, and stronger-than-expected S&P 500 earnings.
However, September historically brings the worst performance and highest volatility for equities. 
Despite this, if the factors driving the current market trend continue and the Federal Reserve cuts interest rates in September as indicated by the latest inflation data (July PCE), the bullish market could persist. 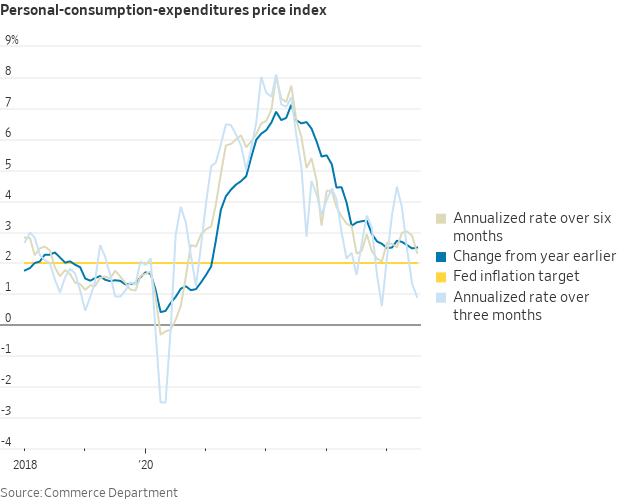
The chart above illustrates the annualized 3-month, 6-month, and 12-month PCE inflation rates, showing a continued disinflationary trend.
With real GDP growth for Q3 2024 revised upward to an annualized +2.5 percent (from a previous estimate of +2.0 percent), the economy remains strong. 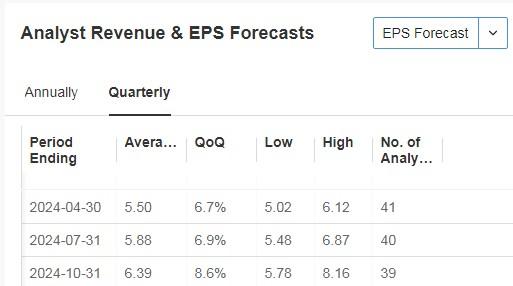
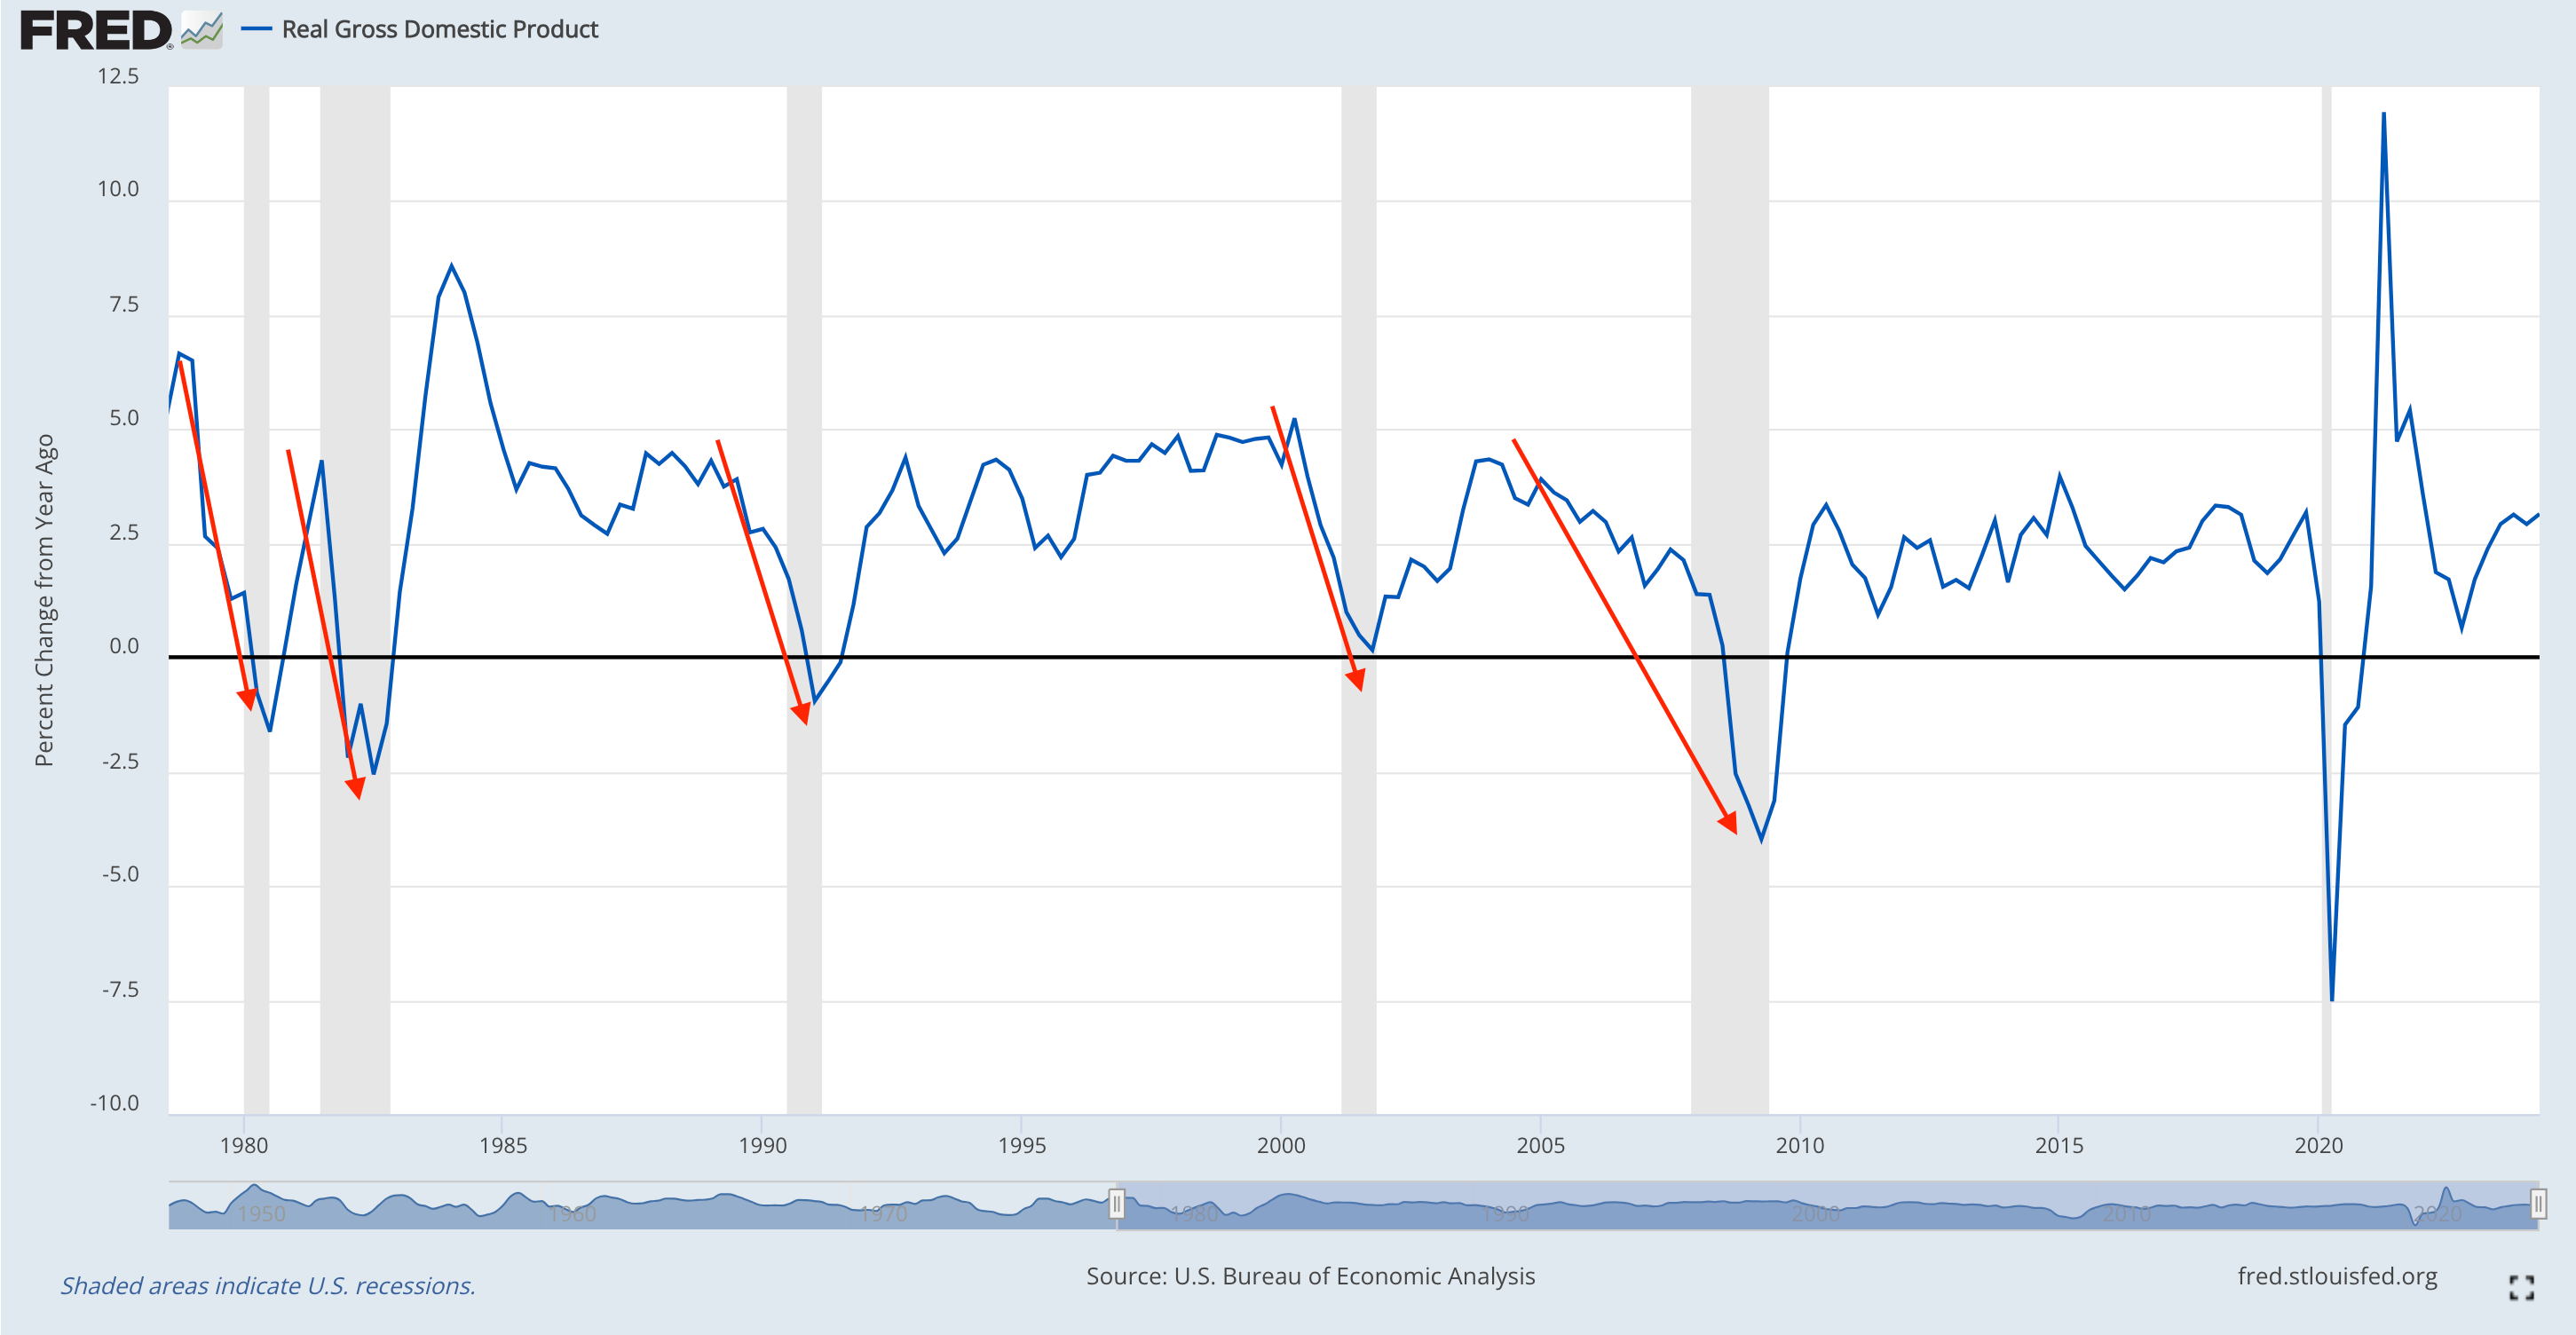
Historically, a deceleration in GDP growth has preceded recessions since 1980 (excluding COVID), so the current acceleration in GDP growth is a positive sign.
Bottom Line
The current data suggests that the economy is doing well, and the bullish trend remains resilient. Those who have tried to go against the trend in recent months have paid a hefty price.
Based on the factors discussed above, September may not be as underwhelming as history suggests.
***
Disclaimer: This article is written for informational purposes only. It is not intended to encourage the purchase of assets in any way, nor does it constitute a solicitation, offer, recommendation or suggestion to invest. I would like to remind you that all assets are evaluated from multiple perspectives and are highly risky, so any investment decision and the associated risk is at the investor's own risk. We also do not provide any investment advisory services. We will never contact you to offer investment or advisory services.
