- Stock market faces headwinds with mixed signals from risk appetite and historical trends.
- Past performance offers some comfort, but returns from different years can deviate significantly.
- Amid geopolitical tensions and inflation concerns, equities face pressure, but historical data challenges the "Sell in May and go away" adage.
- For less than $9 a month, access our AI-powered ProPicks stock selection tool. Learn more here>>
The stock market is navigating a period of uncertainty, with risk appetite showing signs of waning.
Investors are grappling with mixed signals, as evidenced by the lack of clear direction in the ratio of high beta stocks (NYSE:SPHB) to low volatility stocks (NYSE:SPLV). 
In the past, renowned U.S. economist Robert Shiller tackled the question of whether stock prices truly reflect underlying fundamentals.
His research revealed a significant disconnect, with stock prices exhibiting greater volatility and not always aligning precisely with fundamentals.
This highlights the stock market's potential for irrational behavior, with both irrational exuberance and unjustified pessimism leading to price swings.
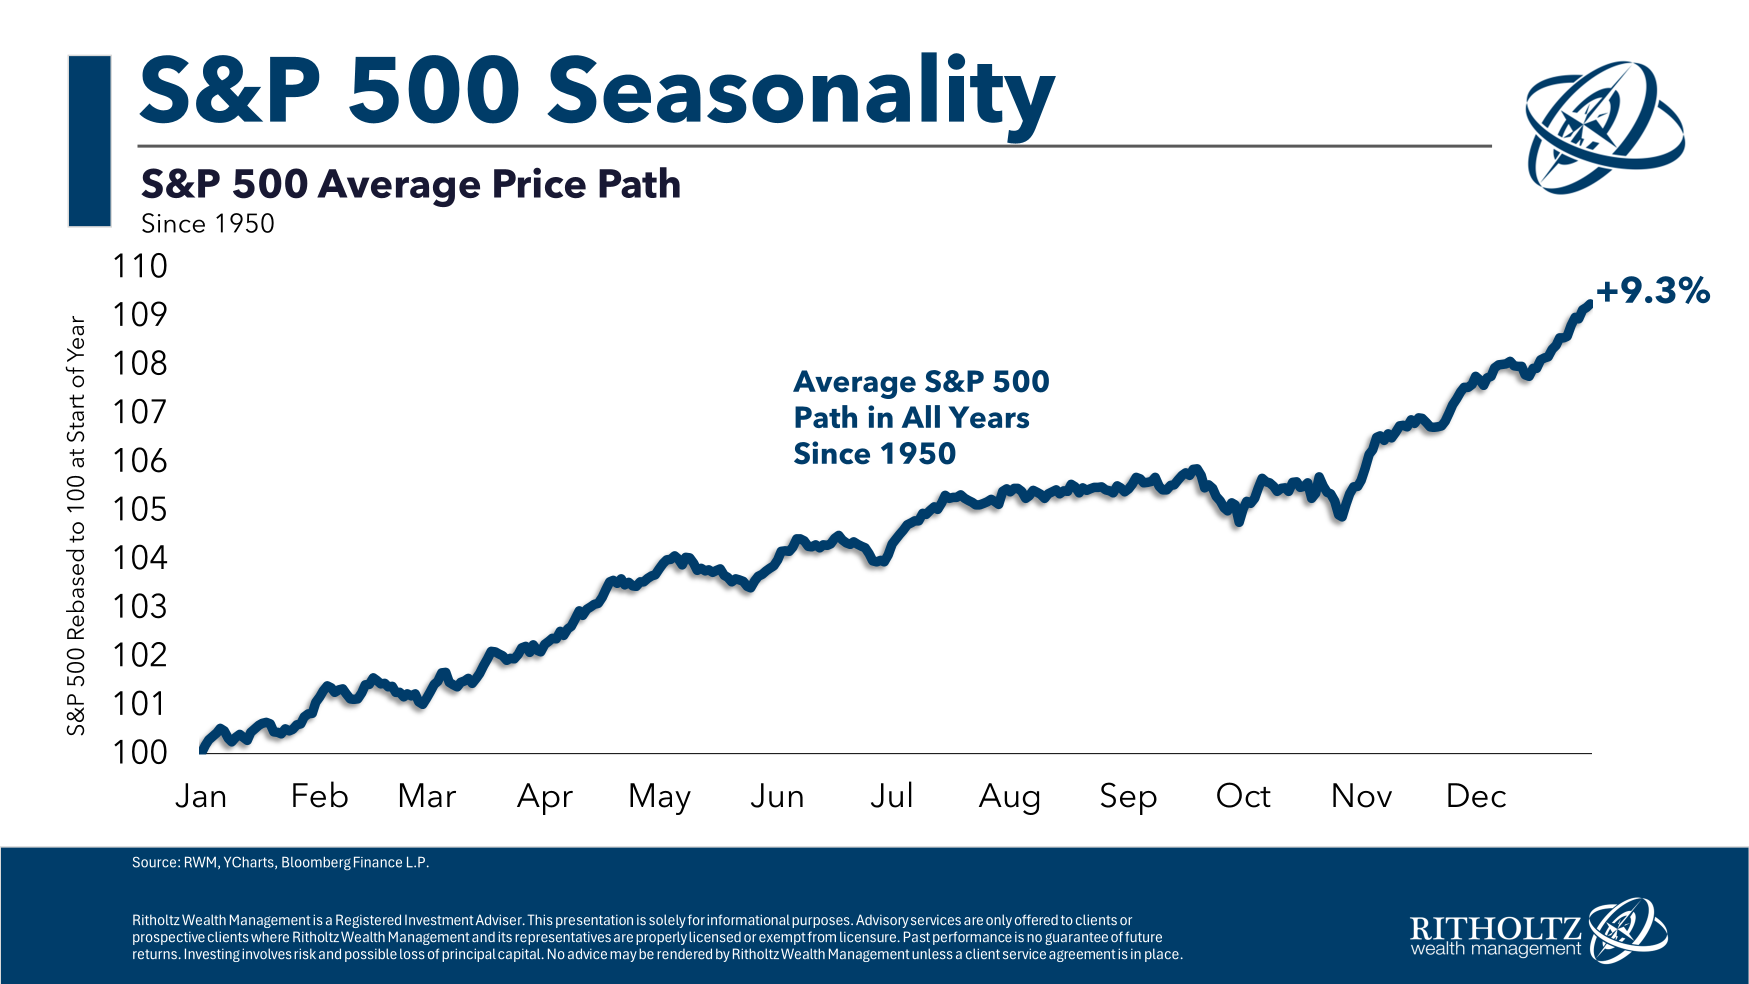
So, investors often find comfort in the historical performance of the S&P 500 index. By calculating the average annual return since 1950, we can visualize this data in the following graph:
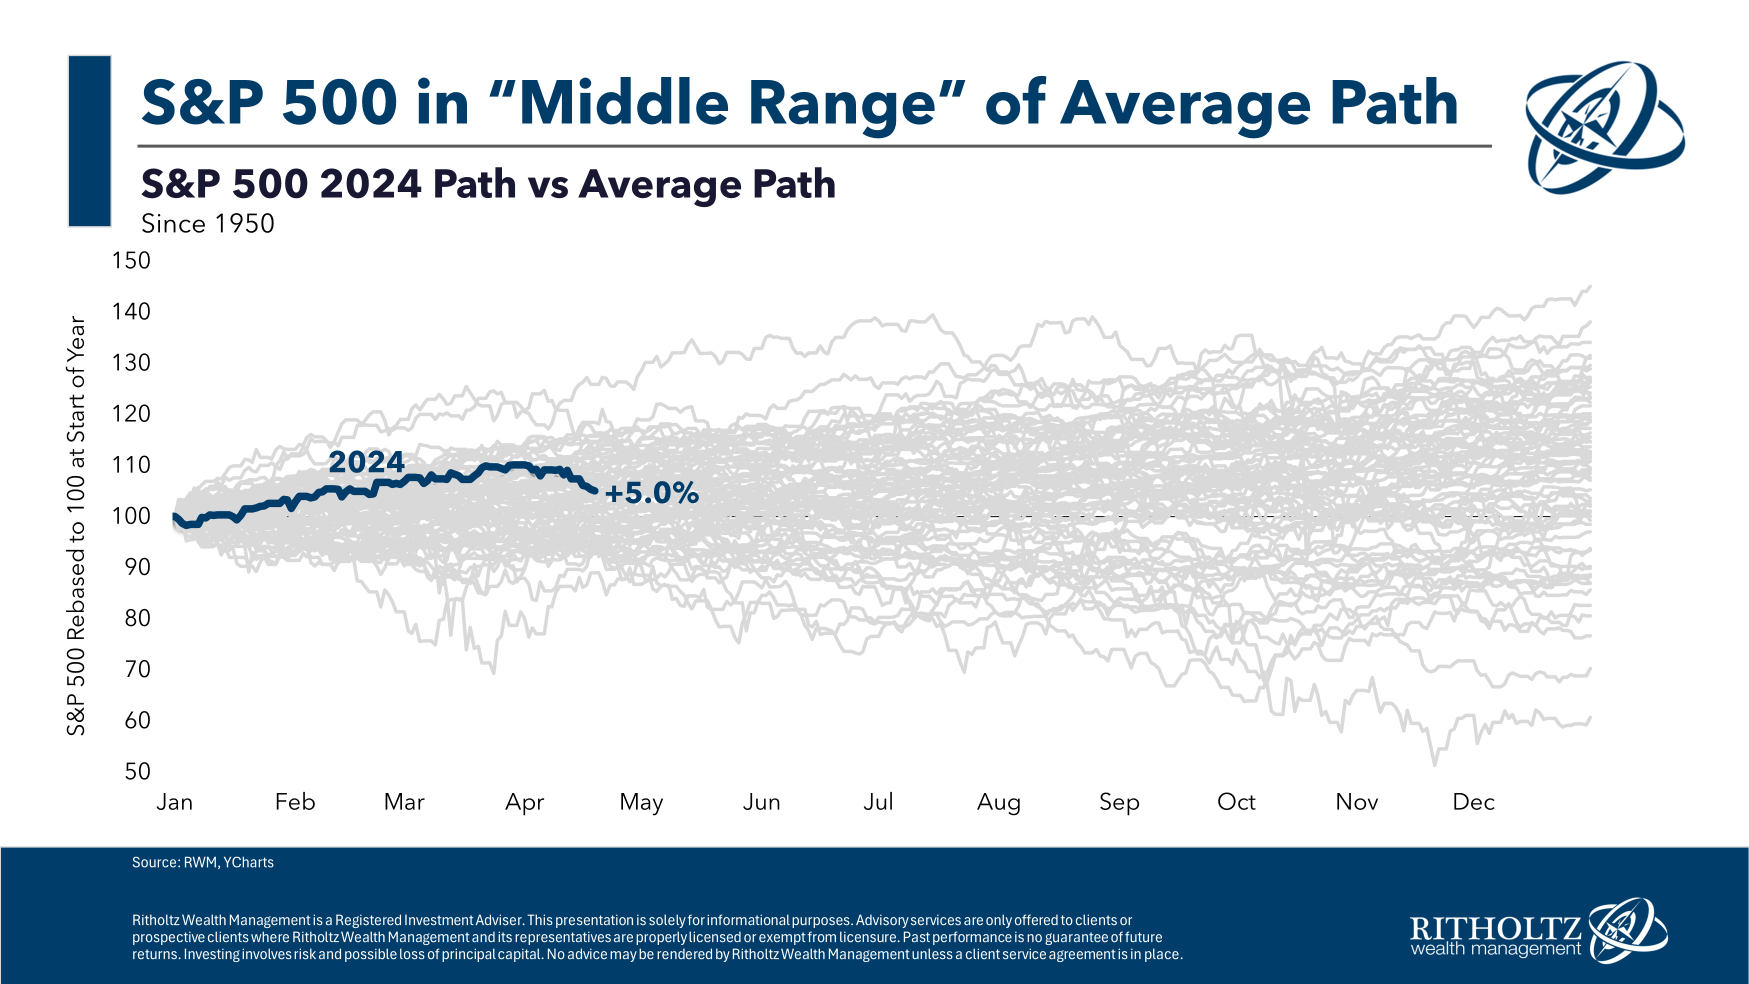
While fluctuations are inevitable, the overall trend for the index is typically upward. However, as mentioned earlier, each year's performance is unique. Analyzing individual years within this average reveals diverse trends, leading to varying returns.

There is no such thing as an average year in the stock market.
Uncertainty Looms, But Could the Bull Market Resume Still?
As of today, amid geopolitical tensions, uncertainty over earnings, accelerating inflation, and the usual seasonal dynamics, equities are under pressure. 
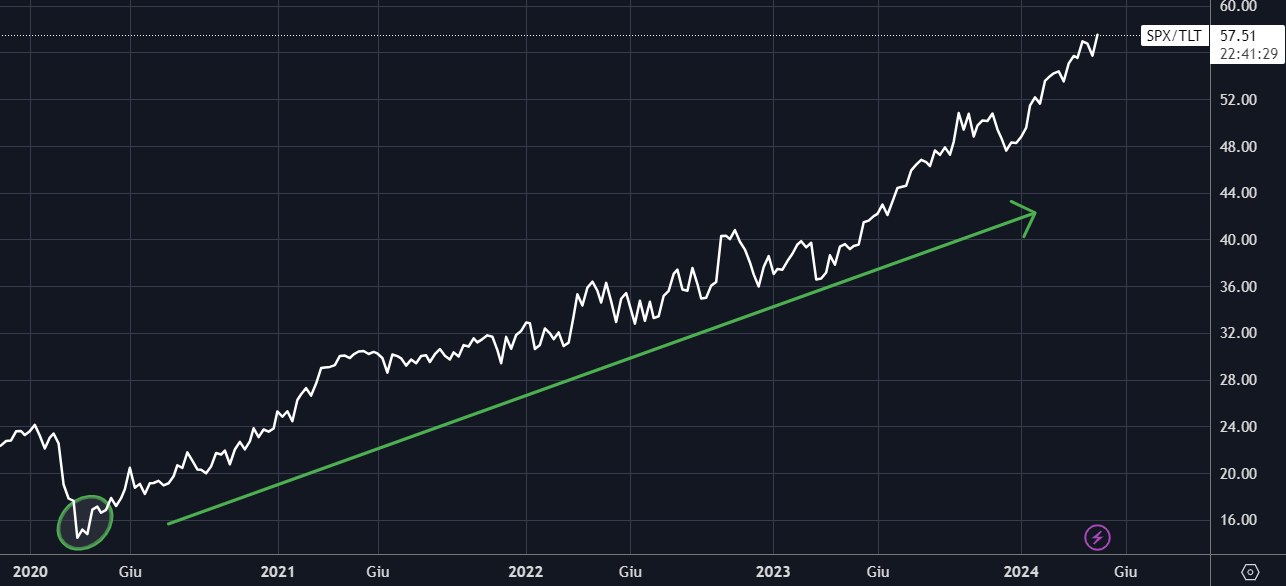
While the ratio of the S&P 500 Index to (NASDAQ:TLT) hit record highs after the market peaked in March, it appears to be reversing course since last week. However, this retracement doesn't necessarily signal the end of the bullish trend that began in 2020.
Much of the current stock market consolidation likely stems from a psychological sell-off. After a stellar 6-month rally with major indexes reaching new highs, it's natural to see a healthy retracement. Volatility during this phase is simply a necessary part of the process.
Sell in May and Go Away in 2024?
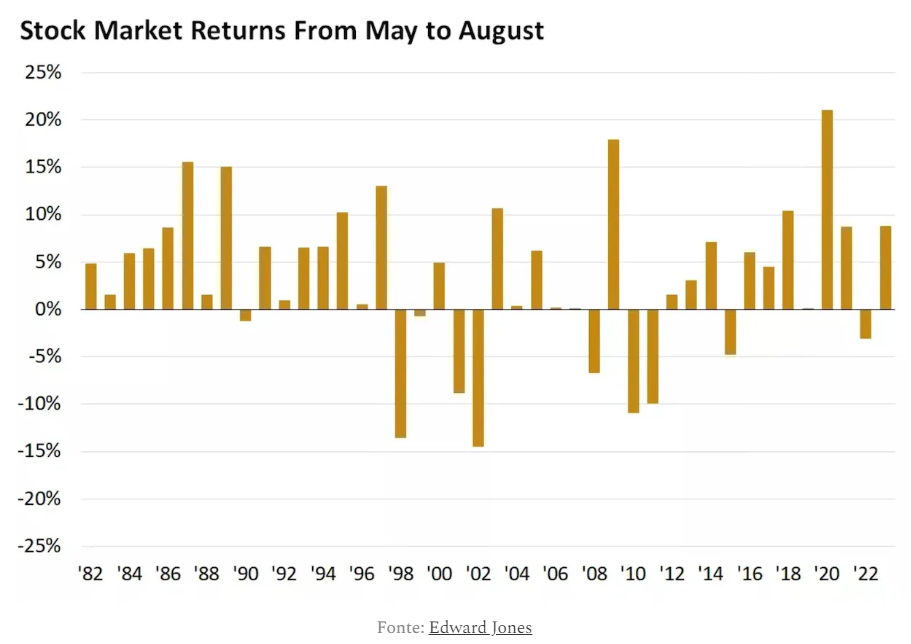
The adage "Sell in May and go away" often resurfaces in late April/early May. However, historical data suggests a different story. While summer months may see some downward movement, statistically, the next 3 months (June-August) often deliver positive returns.

May Performance to Set the Tone for 2024
A positive return in May can be a strong indicator for the year. Since 1982, years with a positive May performance (between 6.5% and 9.5% gains) saw positive trends continuing for the rest of the year roughly 90% of the time, with an average increase of 13%.
Only 1987, 2011, and 2015 defied this pattern, ending the year down despite positive returns in the first four months.
Predicting the future remains an impossible task. Is this a typical correction or the start of a bear market? Only time will tell if the current pullback signifies a shift or simply a healthy pause in the ongoing bull run.
***
Trust InvestingPro and take the best choices with all the data at your disposal: HERE and get over 40% off for a limited time on your annual plan!
Disclaimer: This article is written for informational purposes only; it does not constitute a solicitation, offer, advice, or recommendation to invest as such it is not intended to incentivize the purchase of assets in any way. I would like to remind you that any type of asset, is evaluated from multiple points of view and is highly risky and therefore, any investment decision and the associated risk remains with the investor.

