This article was written exclusively for Investing.com
- Gold had an ugly first quarter
- The price is sitting near a midpoint
- Digesting gains in all currency terms
- Consolidation is not bearish
- Stimulus is bullish - Watch for central bank buying
In August 2020, when gold hit its all-time peak at $2063 per ounce, the yellow metal was the hottest asset in markets. Gold reached an all-time high in US dollar terms last August, but it had been breaking records in other currencies since 2019.
When gold reached its peak, Bitcoin was below the $12,700 level. Since then, gold corrected, and Bitcoin moved almost five times higher. At the $1744.80 level at the end of last week, gold was $318.20 or over 15.4% below its high from less than one year ago.
Gold fell with the US bond market. In early August 2020, the US 30-year Treasury bond futures were at 183-06. Last week, they were below the 157 level, over 14.5% lower. Gold and bonds have been moving in lockstep. Higher interest rates have weighed on the yellow metal as they increase the cost of carrying gold and provide an alternative to gold. Moreover, the ascent of Bitcoin and digital currencies have attracted capital away from the gold market.
The gold bull market began at the turn of this century at the $250 per ounce level. For over two decades, every dip in gold turned out to be a buying opportunity. The uglier the market looked, the better the result for the brave gold value-seekers. At the beginning of April 2021, gold remains out of favor, which could be the perfect reason to load up on the yellow metal that rallies when it looks the worst and corrects when it seems like it is about to go parabolic.
Gold had an ugly first quarter
The falling bond market pushed interest rates higher during the first quarter of 2021. The nearby US 30-year Treasury bond futures contract fell 10.53% despite the Fed’s quantitative easing purchases of $120 billion per month of debt securities. The bonds erased the 10.98% 2020 gain. Rising interest rates tend to be bearish for the gold market.
Meanwhile, the dollar index rose 3.72% in Q1 after falling 6.42% in 2020. Rising rates and an appreciating dollar caused gold to be the worst-performing precious metal over the first three months of 2021.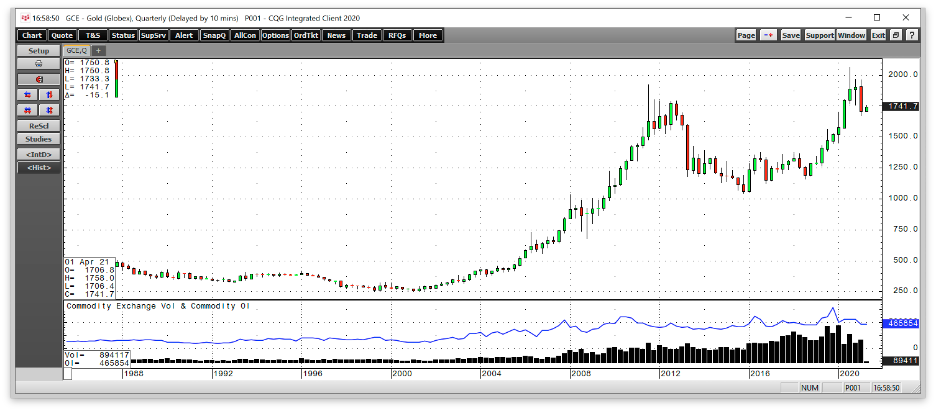
All charts courtesy of CQG
The quarterly chart highlights that gold ended a streak of nine consecutive quarterly gains in Q1 2021 as the yellow metal fell 9.57%. The total number of open long and short positions in the COMEX gold futures market declined from 560,059 at the end of 2020 to 457,315 contracts on Mar. 31, 2021, a drop of 102,744 contracts or 18.35%. Falling open interest when the price of a futures contract declines is not typically a technical validation of a bearish trend in a futures market. The nearly 10% decline in gold’s price caused many investors to exit risk positions on the market’s long side in Q1. Both gold and open interest have edged higher during the early days of Q2.
The price is sitting near a midpoint
Gold broke out to the upside in June 2019 when the price rose above the critical technical resistance level at the July 2016 $1377.50 peak. The July 2016 high became technical support. In August 2020, the price peaked at $2063, which is now the technical resistance level.
The midpoint of the move is at $1720.25 per ounce. At the end of last week, nearby June COMEX gold futures were sitting at the $1744.80 level, just above the midpoint of the crucial technical levels over the past nearly five years.
Digesting gains in all currency terms
In 2019 and 2020, gold reached record highs in almost all currency terms. The final shoe to drop was the dollar-based gold price last July when it moved over the 2011 $1920.70 high. 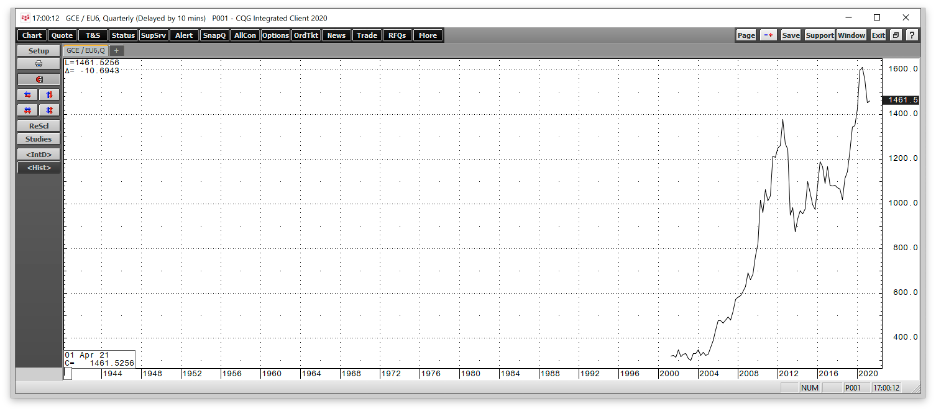
The quarterly chart shows that gold in euro currency terms rose to a new peak in August 2019. 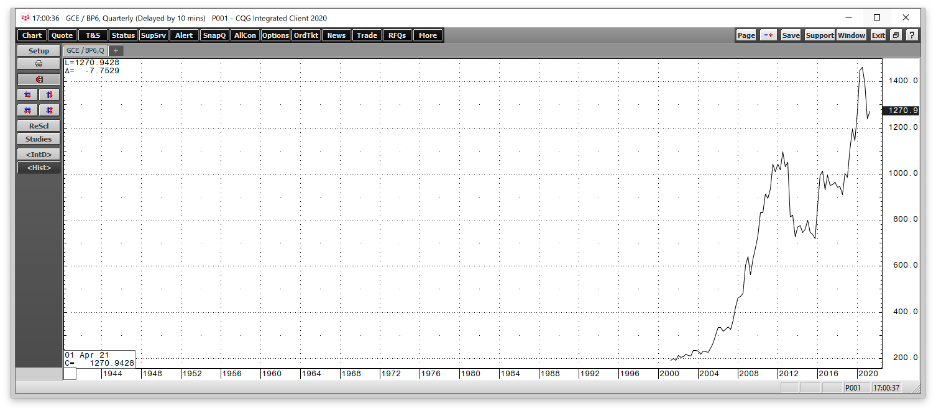
The new record in British pound terms came in July 2019. 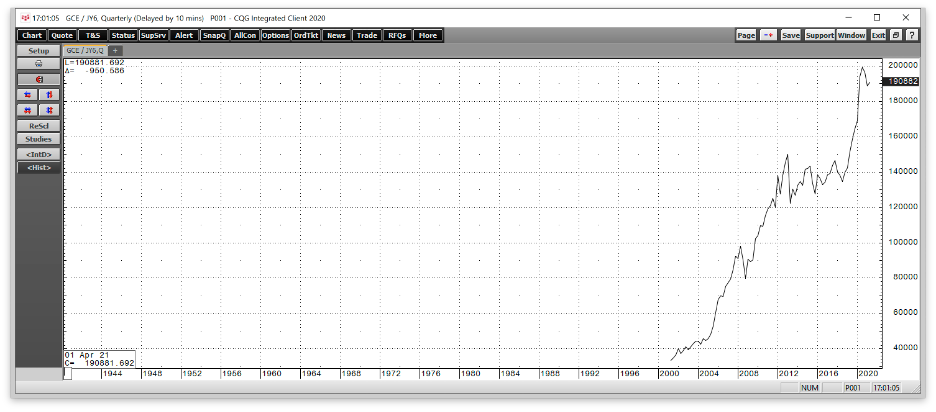
In Japanese yen, the price moved to a new all-time high in July 2019.
Gold rose to record highs in virtually all currencies, including, but not limited to, Swiss francs, The A$ and C$, Chinese RMB, Russian rubles, and many others over the past two years. The yellow metal pulled back in all currency terms in Q1 2021.
Consolidation is not bearish
Bull markets rarely move in straight lines. As a hybrid between a commodity and currency, gold volatility tends to be lower than most other raw material markets but higher than the currency arena.
After reaching an all-time peak last year, gold is digesting the move higher and consolidating around the midpoint of its breakout level and recent record high. Gold has made higher lows and higher highs for more than two decades. 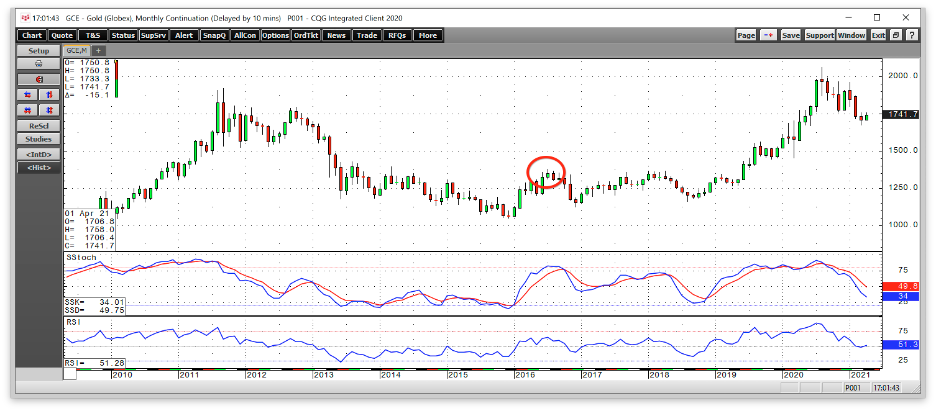
The monthly chart shows that maintaining the bullish long-term trend depends on remaining above the $1377.50 level. Gold’s current price action could take it to a far deeper correction, but the bullish trend remains firmly intact from a long-term technical perspective. Price momentum is falling on the monthly chart, but it is heading towards an oversold condition at the beginning of April. The relative strength indicator was sitting at a neutral reading.
Meanwhile, sentiment is critical for gold. Since the turn of this century, gold had found bottoms during corrections when the sentiment turned negative. It reached highs when the bullish frenzy peaked, as it did in August 2020 at over $2000 per ounce. Gold has taken a back seat to Bitcoin and cryptocurrencies in 2021, with bullish sentiment falling to the lowest level since 2018.
At the $1744.80 level, gold continues to consolidate and digest last year’s gains, and that is not bearish.
Stimulus is bullish - Watch for central bank buying
Central banks had been high-profile buyers of the yellow metal over the past years, adding to reserves. Governments hold gold as an integral part of foreign exchange reserves, which validates the yellow metal’s role as a currency and a commodity. In 2018 and 2019, central banks bought the most gold since the 1960s. In 2020, the move to above $2000 caused many governments to refrain from purchases.
With the price off the high in 2021, central banks are likely to return to the gold market. Poland plans 100 tons in purchases over the coming years. Russia had bought an average of 205 tons every year from 2014 through 2019. In 2020, the Russians only purchased 27 tons. China had also been a high-profile buyer of the yellow metal over the past years.
Meanwhile, it is challenging to gauge Russian and Chinese gold buying as both countries are substantial producers. Domestic output is likely building both government’s reserves. Since strategic reserves are state secrets, the full extent of Russian and Chinese activities in the gold market lack transparency.
Meanwhile, at the $1744.80 level, central banks are likely to return to the gold market in 2021. They are more likely to buy gold than Bitcoin as governments have a natural aversion to cryptocurrencies as they threaten control of the money supply.
The tidal wave of central bank liquidity and tsunami of government stimulus programs caused by the global pandemic is highly inflationary. The bond market is signaling rising inflationary pressures. The pandemic’s financial legacy will last for years, if not decades, as deficits are rising, and fiat currency values are declining. The US dollar index may have rallied by 3.72% in Q1, but it could be the healthiest horse in the glue factory that houses fiat currencies.
The correction in the yellow metal since last August could be a golden opportunity for investors. Gold has been a means of exchange for thousands of years, and its role in the global financial system is not changing any time soon. Buying gold when it looks worst has been the optimal approach for investing over the past two decades.
It is virtually impossible to pick bottoms in markets during corrections. A scale-down buying approach in the gold market could produce precious returns when the precious metal shines again in the coming months and years.
No one is watching gold closely these days, which could be the perfect reason to load up on the yellow metal.
