To the longs in natural gas, Santa’s sleigh seems to have just whizzed past this year, without making a pit stop to deliver gifts at the Henry Hub.
Hopes of pre-Christmas cheer for gas bulls were dashed on Wednesday after a much lower stockpile drawdown for heating was reported by the U.S. Energy Information Administration than anticipated by the market. The EIA said gas in storage slid by 152 billion cubic feet for the week ended Dec. 18. The consensus of analysts’ estimates for the draw was 160 bcf.
While an 8-bcf shortfall may not seem like much, in a market already weakened by questionable demand for heating due to a fall season that has seen more warmth than cold, it can be vexing.
In the previous week to Dec. 11, the storage decrease in natural gas was larger than the 5-year average, due to a blast of frigid temperatures that took inventories down to 3.57 trillion cubic feet. Even so, that stockpile level was still 6.5% above the typical 5-year metric.
The latest storage report, released a day earlier than the typical Thursday schedule due to Friday’s Christmas holiday, reverses any positive impact created by the previous week’s outsize draw, said Dan Myers, analyst at Houston-based gas risk consultancy Gelber & Associates.
More Cold Will Be Needed
In an email to the firm’s clients on Wednesday, Myers added:
“This withdrawal failed to live up to G&A’s more bullish expectations and indicated that the market was still evenly supplied last week on a temperature adjusted basis.”
“More cold will be needed in upcoming forecasts if the market is going to recover its footing going into the holidays and prevent a collapse to the January contract’s prior lows.”
Weather forecasts generally show temperatures trending around 40 degrees Fahrenheit over the next four days in the U.S. Northeast. That’s much higher than the freezing point levels of 32 Fahrenheit and below needed to ensure good heating demand in the country’s largest gas-fired heating region. Also, the four-day stretch shows that the Christmas period is almost certain to be warmer than usual.

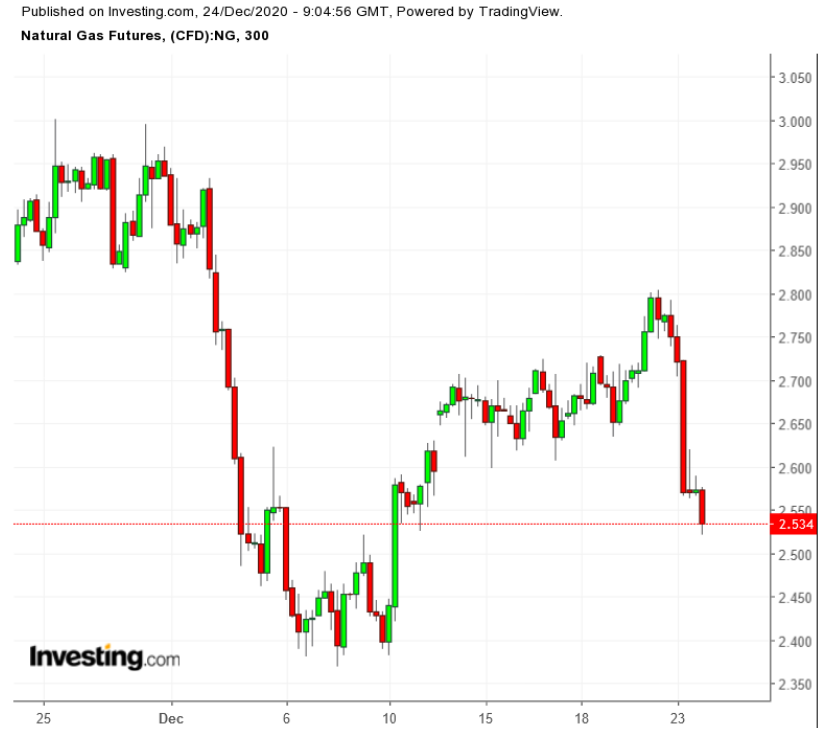
Natural gas futures on New York’s Henry Hub tumbled 6% upon the release of the EIA data on Wednesday, and another 2% in Thursday’s pre-market, heading for the first weekly loss in three.
Hovering at $2.54 per mmBtu, or million metric British thermal units, Henry Hub’s front-month February gas is now further from the $3 mark that gas bulls typically target for the winter.
At Wednesday’s settlement, all Henry Hub contracts for January through April—accounting for the entire winter strip of 2021 and into early spring—were at between $2.56 and $2.60.
Some trading houses, however, think the weather may still turn sufficiently cold over the next three to four weeks, giving hope for gas price ranges that could get nearer to the $3 target.
EBW Analytics Group is one of them. In a blog that appeared on the naturalgasintel.com portal, the agency cites DTN weather data that shows the 16-to-30 day outlook “suggests enduring warmth out West.” But temperatures for the eastern half of the Lower 48 states are in line with 30-year norms, it adds.
“While the first half of that outlook leans warmer than normal, “tropical patterns suggest a moderately colder-than-normal mid-January,” analysts at EBW said in a note. “What’s more, ‘extremely cold’ conditions next month are possible, should the polar vortex splinter and dip into the Lower 48.”
As for January itself, EBW’s analysts said, “the trend will be significantly bullish in the weeks ahead. The market’s storage buffer has limited the impact of higher demand and fading supply. As storage surpluses turn to deficits, however, it is likely to spur a price response for the February and March contracts.”
In terms of gas technicals, Investing.com’s Daily Technical Outlook has turned into ”Strong Sell” from a previous “Buy” on Henry Hub’s front-month February contract. Support first emerges at $2.519, then at $2.429 and later at $2.292.
Should the trend return to bullish, then resistance will likely be first at $2.746, then at $2.883 and later at $2.973.
In any case, the pivot point between the two is $2.656.
As with all technical projections, we urge you to follow the calls but temper them with fundamentals—and moderation—whenever possible.
Disclaimer: Barani Krishnan uses a range of views outside his own to bring diversity to his analysis of any market. He does not own or hold a position in the commodities or securities he writes about.
