- The Nasdaq 100 index is set to undergo its third rebalancing in history
- It will reduce the weight of the top seven stocks in the index
- Could that induce selling pressure from ETFs that track the index?
Back in 1998 and 2011, the Nasdaq 100 index faced a similar problem it faces today. First, with Microsoft (NASDAQ:MSFT) making up more than 25% of the entire basket, and later with Apple (NASDAQ:AAPL) taking up 20% of the index.
Interestingly, although Apple's market capitalization was similar to that of Microsoft, its impact on the index was five times stronger due to a previous correction. In both cases, they decided to do a 'special' rebalancing to solve funds' diversification issues.
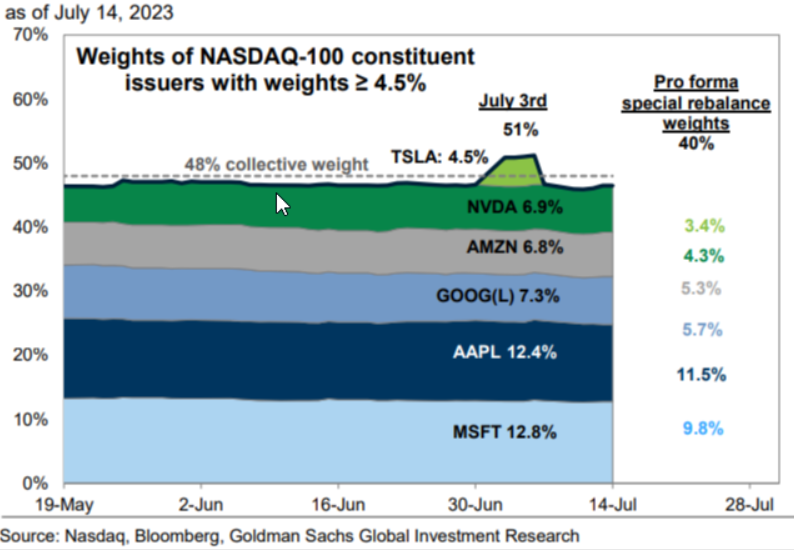
And guess what? Today marks the third rebalancing of the Nasdaq. This time, things are a bit different. They're going to rebalance the first six stocks: Apple, Microsoft, Alphabet (NASDAQ:GOOGL), Amazon.com (NASDAQ:AMZN), NVIDIA Corporation (NASDAQ:NVDA), Tesla (NASDAQ:TSLA), and maybe Meta Platforms (NASDAQ:META), which is currently still below the 4.5% threshold.
These six stocks account for more than 50% of the benchmark and a whopping 77% of the index's annual earnings. Once again, this poses a diversification-related difficulty for funds trying to replicate the index.

Forget about those conspiracy theories aiming to limit tech; the reality is quite different. The percentage reduction of the stocks mentioned above is solely due to regulatory factors.
With that said, the rebalancing will indeed reduce the influence of tech giants while increasing the presence of other Nasdaq stocks. Let's take a moment to appreciate the remarkable gains of these megacap tech companies this year.
On average, they have surged by over 70% since the beginning of the year, which is three times the average performance of stocks in the U.S. index.
As of July 20, 2023, here are the year-to-date performances of some key tech companies:
- Apple: +48%
- Microsoft: +44%
- Alphabet: +36%
- Amazon: +54%
- Nvidia: +203%
- Tesla: +111%
- Meta: +144%
These gains are truly impressive, but the rebalancing aims to ensure a fairer representation in the Nasdaq 100 index.
The expected outflow will range from $10 to $15 billion. Companies like Tesla are anticipated to have smaller cash outflows, resulting in a lesser impact compared to Alphabet and Microsoft.
Now, it's time to jump into action and create an advanced watchlist on InvestingPro to closely monitor the 7 stocks involved in the rebalancing.
Source: InvestingPro
Analysts' average targets suggest that these stocks have an average upside of 10%, indicating that they are currently considered fairly valued. Specifically, they believe Alphabet, Meta, Microsoft, Nvidia, and Amazon are undervalued by an average of 10% of their current values.
On the other hand, according to InvestingPro's Fair Value analysis, Nvidia and Apple show an average potential decline of 20%, Microsoft 5%, and the only positive note is for Google, which has a potential upside of 18.5%.
While this rebalancing can be viewed as an opportunity to curb the financial dominance of big tech companies, which has raised concerns about their influence on the index, another question arises: Could the ETFs (replicators) themselves, due to forced rebalancing, trigger significant selling pressure?
The weight of the top 7 stocks within the basket will vary as follows:
- Apple: From 12.1% to 11.5%
- Microsoft: From 12.8% to 9.8%
- Alphabet: From 7.6% to 5.7%
- Amazon: From 6.9% to 5.3%
- Nvidia: From 7.3% to 4.3%
- Meta: From 4.4% to 3.7%
- Tesla: From 4.5% to 3.4%
A total of 11.9% will be subtracted from the current weighting.
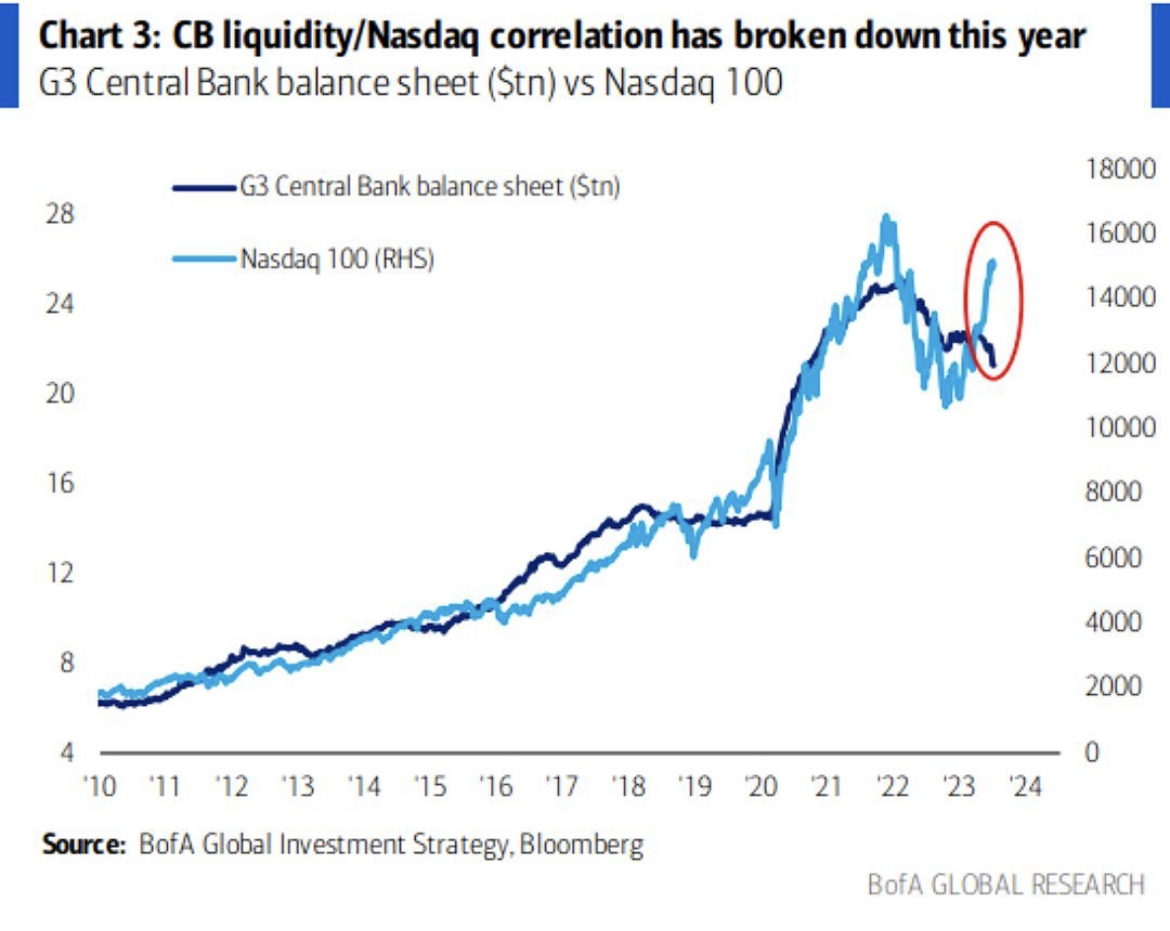
Fed Liquidity - Nasdaq 100 Correlation Breaks Down: Correction Imminent?

Until 2010, we observed a robust positive correlation between the Fed's balance sheet and the rising Nasdaq 100 index, as evident from the chart above.
However, in recent times, there appears to be a breakdown in this correlation. While the Fed's balance sheet has been falling, the index continues to rise.
Given this unusual divergence, the question arises: Should we anticipate a correction in the Nasdaq 100 index at this point?
Disclaimer: This article is written for informational purposes only; it does not constitute a solicitation, offer, advice, counsel or recommendation to invest as such it is not intended to incentivize the purchase of assets in any way. I would like to remind you that any type of asset, is evaluated from multiple perspectives and is highly risky and therefore, any investment decision and the associated risk remains with the investor.

