- 2024 has kicked off in a sideways trend
- However, commodities-to-S&P 500 ratio's consistent decline throughout the previous year suggests a persistent bullish market
- Meanwhile, behemoth's like Apple (NASDAQ:AAPL) and Amazon are facing headwinds, weighing on overall performance
- Looking to beat the market in 2024? Let our AI-powered ProPicks do the leg work for you, and never miss another bull market again. Learn More »
The beginning of 2024 has unfolded without significant events that investors might consider relevant.
'Buy the dip' mentality has persisted, as there have been no compelling signals of panic selling.
For the majority of investors, the focus remains on avoiding potential missed opportunities for the next bullish wave rather than falling into a potential bull trap.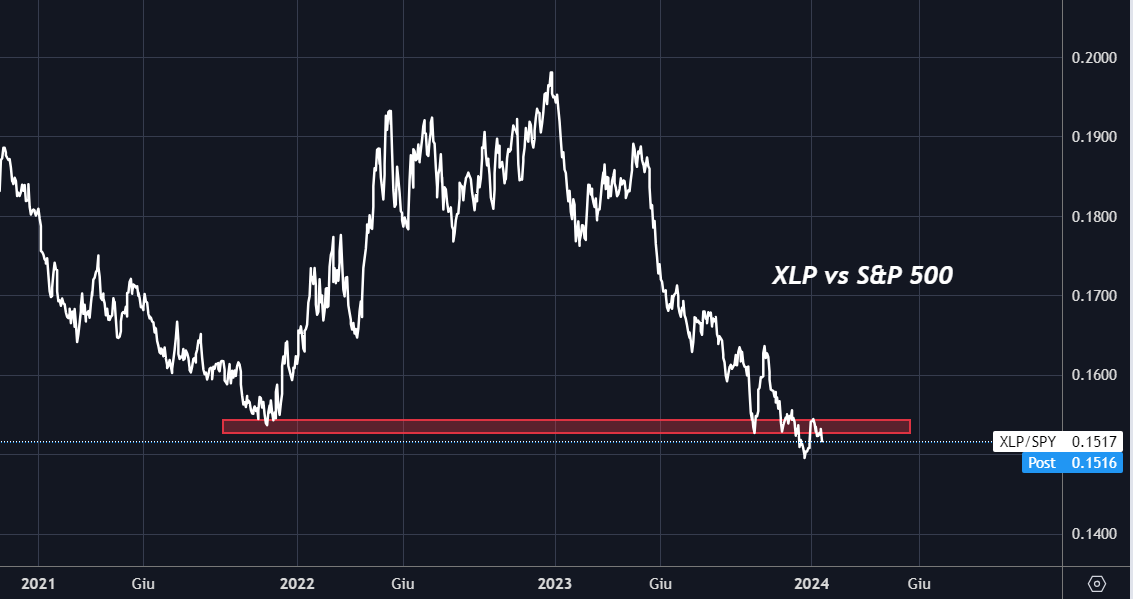
This sentiment is supported by the ratio of commodities to the S&P 500, which has been steadily declining throughout last year confirming that we were in a bullish market.
Until today, it is below the lows of late 2021, showing no new evidence of trend change.
A possible recovery of past levels, highlighted in red on the chart, will probably signal an environment in which stocks could go through more difficult times than in 2023.
On the other hand, confirming the evolution and change in market sentiment could be the nature of the U.S. dollar.
We know that it has a strong negative correlation with the stock market, and its strengthening would lead to a weakening in equities. 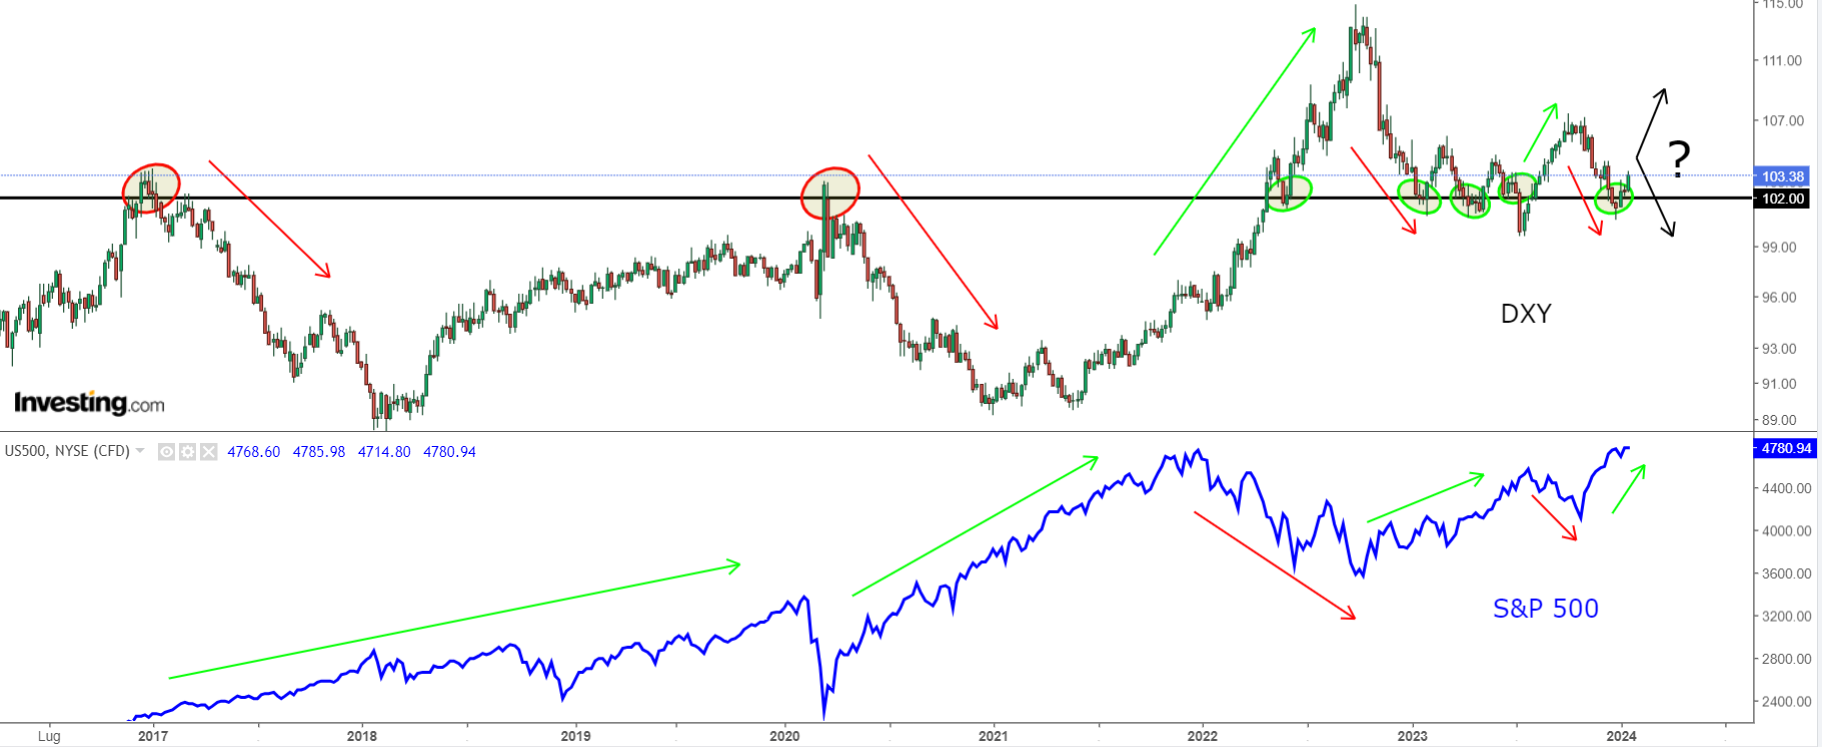
As of today, compared to the previous report, the U.S. dollar index is strengthening turning out to be above 102 and consequently signaling a possible change in the environment to the detriment of the bulls.
Viewing previous years and the reactions of the S&P 500, this level is seen as a watershed, between bullish and bearish trends. The moment the dollar stabilizes above it, equities tend to reverse to the downside.
That said, in the coming months, many expect the market to continue the same trend as in 2023, hoping for new highs.
Amazon Stock Targeting $165?
If we focus on Amazon (NASDAQ:AMZN), over the past 5 years it has performed +80.99%.
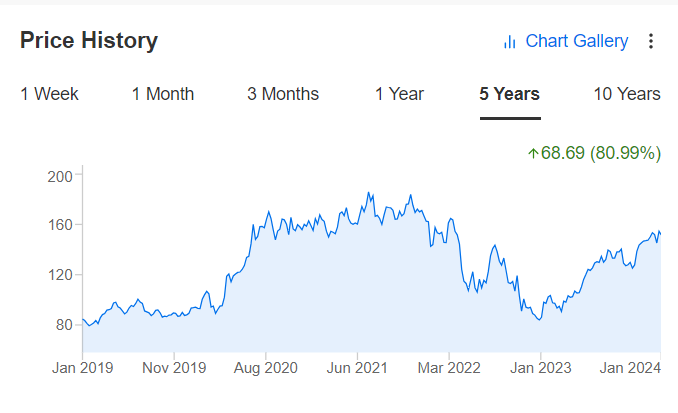
Source: InvestingPro
But at the same time, during the same period in question, it has underperformed the S&P 500 index.
The stock has not touched all-time highs for more than 20 months (624 days), which corresponds to the longest period and twice as long as the previous one that occurred in 2018-2019. 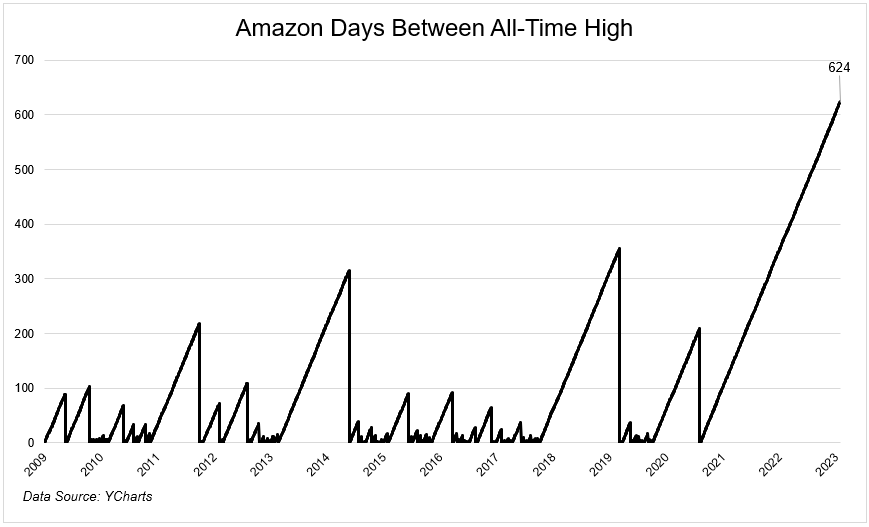
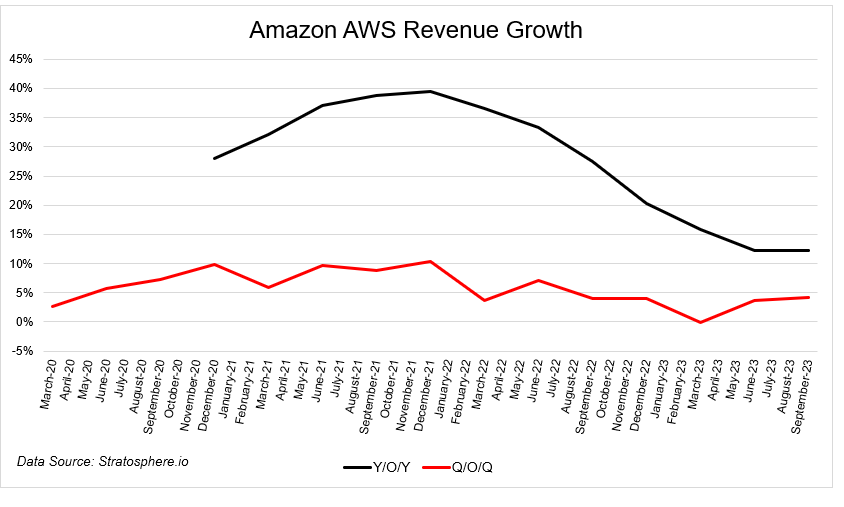
What has weighed on the company over the past two years has been the segment responsible for most of its profits, Amazon Web Services (AWS),.
This platform offers cloud computing services, which has seen a slowdown due to strong competition from Microsoft (NASDAQ:MSFT) and Google (NASDAQ:GOOGL).
Specifically, Microsoft's cloud division, which accounts for more than 50 percent of its revenue, came in at $127 billion in annual revenues, with gross margins over 72 percent.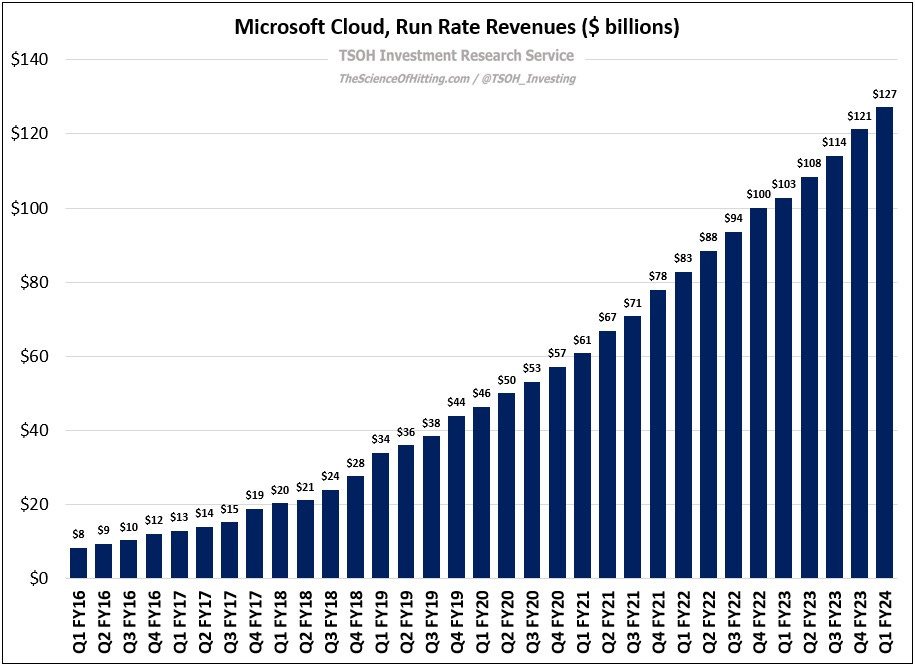
Azure, the engine of the cloud business, is growing by more than 25 percent annually. Because of this, Microsoft is way ahead and will certainly continue to see its profits rise.
Amazon, with a $40 billion revenue, ranks among the world's largest advertising companies.
Like Netflix (NASDAQ:NFLX), it aims to leverage advertising through its newly launched streaming service, eyeing a return to previous highs. 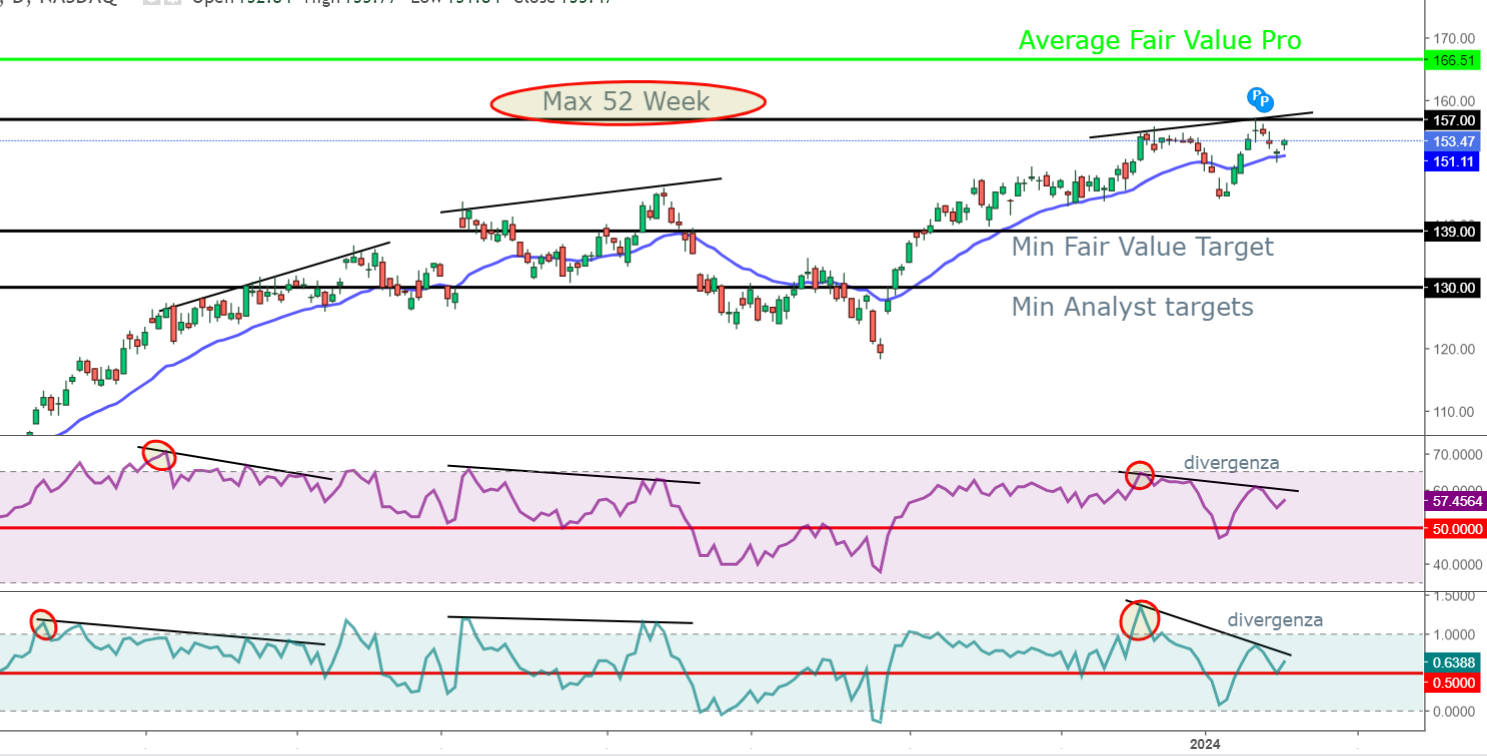
In recent chart analysis, attempts to breach the $157 level faced resistance, resulting in a bearish divergence with the RSI and %B indicators.
A confirmation of downturns would be signaled by a break below the 21-period moving average and caution levels indicated by level 50, aligning with Fair Value and Investing Pro analysts' identified decline area.
Meanwhile, the medium to long-term upside target is set at $165 according to Investing Pro analysis.
***
In 2024, let hard decisions become easy with our AI-powered stock-picking tool.
Have you ever found yourself faced with the question: which stock should I buy next?
Luckily, this feeling is long gone for ProPicks users. Using state-of-the-art AI technology, ProPicks provides six market-beating stock-picking strategies, including the flagship "Tech Titans," which outperformed the market by 670% over the last decade.
Disclaimer: This article is written for informational purposes only; it does not constitute a solicitation, offer, advice, or recommendation to invest as such it is not intended to incentivize the purchase of assets in any way. I would like to remind you that any type of asset, is evaluated from multiple points of view and is highly risky and therefore, any investment decision and the associated risk remains with the investor.

