This article was written exclusive for Investing.com
- Inflationary tidal waves and tsunamis
- Lumber rises to an incredible high
- Palladium moved to a record level
- Copper’s ascent has been breathtaking
- Other raw material markets are following - a few laggards to watch
The US Fed Chair and Secretary of the Treasury continue to tell us inflationary pressures seen in recent producer and consumer price index data are “transitory.” Meanwhile, economics is a social science. The formulas that measure the economy are only as good as the variables. While many economists would argue, I view econometrics as an art instead of a science. It is also a political tool that can validate monetary and fiscal policy to fit a political rather than an economic agenda.
While pressure has been mounting on the Fed to acknowledge rising commodity and asset prices as validating increasing inflation, Fed Chair Powell has not only called the economic condition “transitory,” but has also said that full employment is necessary for the central bank to “start thinking about thinking about” tapering asset purchases or increasing the short-term Fed funds rate. As asset prices rise, the central bank and Treasury have been feeling the pressure. On May 4, Secretary Yellen told markets that interest rates might have to increase, but she quickly qualified that statement on May 5, citing “transitory,” inflationary pressures. The term is likely to go down in history along with other central bank favorites like Alan Greenspan’s “irrational exuberance.”
The April US employment report took some pressure off the Fed as the number of jobs rose by only 266,000, well below market expectations, and the unemployment rate ticked higher to 6.1% in April. However, commodity prices continue to shout that “transitory” pressures are rising to levels that are a real and present danger to the economy. Raging inflation is a challenging beast to tame. Last week’s CPI data came in at 0.8% compares to expectations for 0.2%.
While economists are confident they can manage the pressures with monetary policy tools, there are no guarantees. Moreover, monetary and fiscal policies have created the current inflationary pressures, much as they did back from 2008 through 2012 in the wake of the global financial crisis.
Albert Einstein said that the definition of insanity is doing the same thing repeatedly and expecting a different result. The 2020 pandemic is a far different event than the 2008 financial crisis, but the tools to stabilize the economy have been the same. The only difference is that in 2020, the amounts dwarfed the 2008 levels.
Inflationary tidal waves and tsunamis
At the rate of $120 billion per month, the Fed’s debt purchases and a Fed Funds rate of zero to twenty-five basis points, the US central bank has created a tidal wave of liquidity in financial markets. Government spending in the trillions to stabilize the economy during the pandemic is a tsunami of stimulus. While vaccines are creating herd immunity to COVID-19, the spending and flow of liquidity continue to flood the financial system. The price tag is staggering, and the debate of how to deal with the bill will be a political issue over the coming years and perhaps decades. The US national debt is closing in on the $30 trillion level. The dollar index is flirting with the 90 level on the downside again as monetary and fiscal policies weigh on money’s purchasing power. While the dollar is the world’s reserve currency, and the dollar index measures the US currency against other reserve currencies, the ascent of commodity prices tells us that all fiat money is losing value.
Inflationary pressures are rising, but the Fed tells us it is not yet time to “think about thinking about” increasing short-term rates or ending quantitative easing. The price action in three markets that have recently reached all-time peaks warns us that inflation may not be all that “transitory.”
Lumber rises to an incredible high
Before 2018, the lumber futures prices never traded above $493.50 per 1,000 board feet.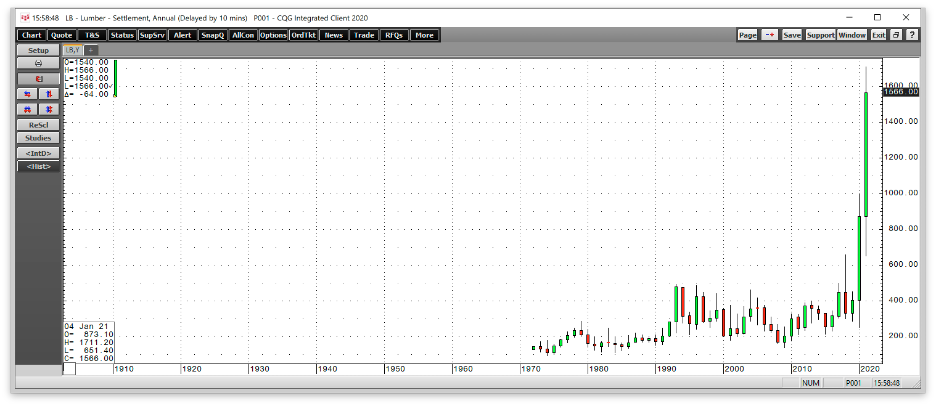
Source: CQG
The annual lumber chart dating back to 1972 shows the explosive price action in the wood market, with the price reaching $1711.20 in May 2021, nearly three and one-half times the price of the pre-2018 high. Slowdowns and shutdowns at lumber mills created a shortage during the pandemic when the demand for new home construction exploded. Framing lumber is in short supply these days. Moreover, the rising potential for a US infrastructure rebuilding program supports the lumber price as wood is a critical construction input.
Lumber is an illiquid futures market with a low level of open interest and daily volume. However, the futures market is a benchmark for the wood price, which is trading at an all-time high in May 2021. Meanwhile, lumber is not the only raw material that has risen to an all-time high this month.
Iron ore is the primary ingredient in steel. Iron ore prices have also moved to lofty levels over the past months.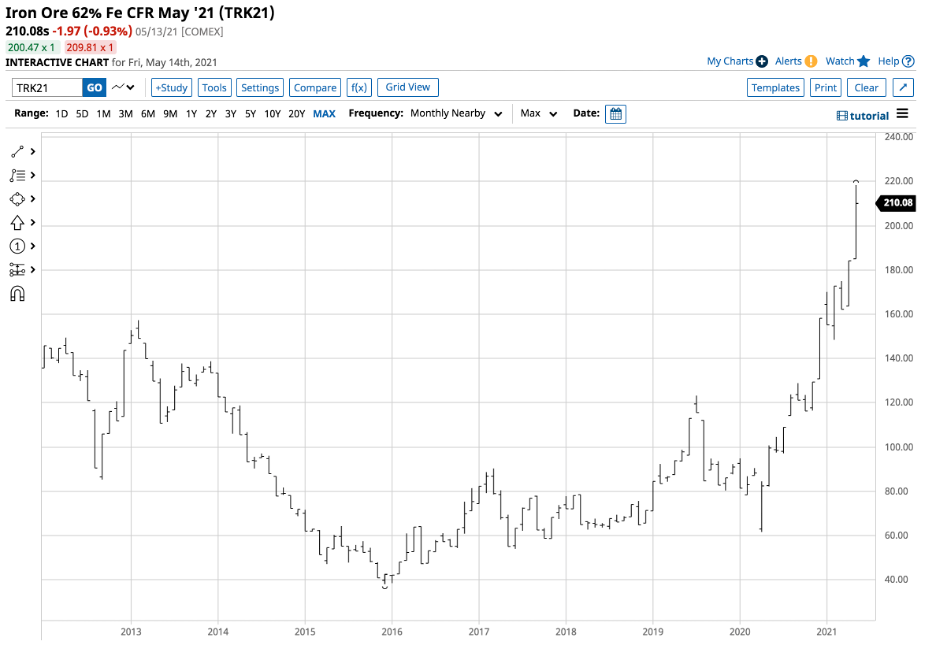
In May 2021, iron ore prices have risen to nearly $220 per ton as steel demand is exploding.
Palladium moved to a record level
Palladium is a rare precious metal that is a member of the PGM or platinum group metals sector. Palladium is a critical ingredient in catalytic converters that reduce emissions from gasoline-powered engines. Palladium is a dense metal with high heat resistance, making it an industrial and precious metal with many applications.
Source: CQG
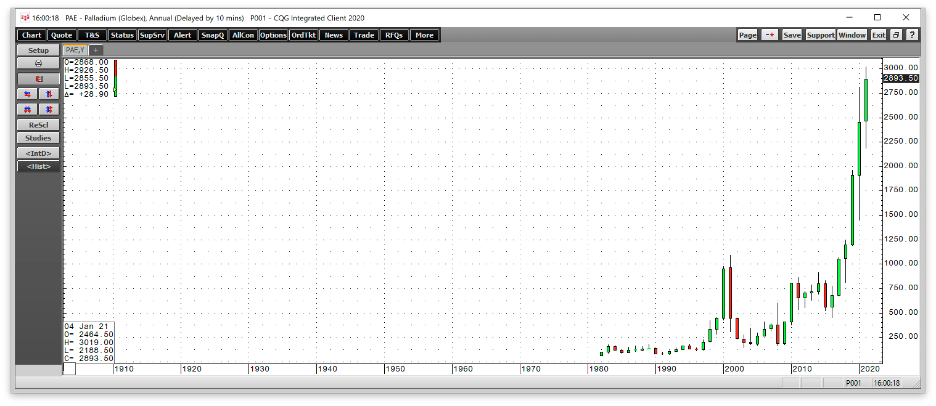
The annual chart highlights palladium’s ascent to a new all-time high in May 2021 at $3019 per ounce. Annual palladium output comes primarily from two countries; South Africa and Russia. While South African production is primary, Russian output comes as a byproduct of nickel production, mainly in the Norilsk region of Siberia.
The green revolution addressing climate change supports the rise of palladium, as does rising inflationary pressures in the global financial system.
Copper’s ascent has been breathtaking
Many market participants consider copper, the red nonferrous industrial metal, Doctor Copper, as the price action can diagnose the state of the global economy. The world’s leading producer is Chile, and China is the 800-pound gorilla on the fundamental equation’s demand side.
In 2011, increased inflation following the 2008 financial crisis and global economic expansion pushed copper to an all-time high of $4.6495 per pound. In May 2021, that peak gave way to a higher high.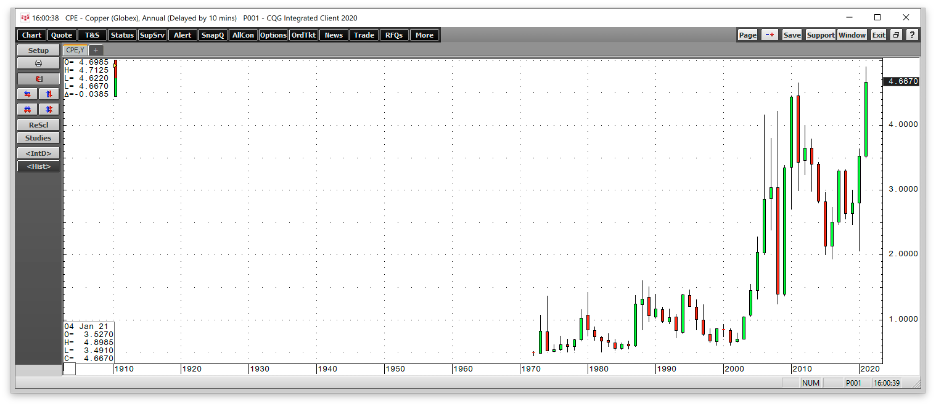
Source: CQG
The annual copper chart shows the move to $4.8985 per pound in May 2021. Goldman Sachs recently called copper “the new crude oil.” Goldman forecast that copper prices on the London Metals Exchange would reach $11,000 per ton over the next twelve months. The price was moving towards that level last week. The analysts believe that copper could reach $14,000 per ton or higher by 2025. The green policies, infrastructure building in China and rebuilding in the US, and a semiconductor shortage are increasing copper demand. It takes eight to ten years to develop new mines. Growing demand is outstripping current annual supplies, pushing the red metal’s price to record levels.
Copper is the leader of the base metals that trade on the London Metals Exchange. Aluminum, nickel, lead, zinc, and tin prices are all moving higher alongside copper.
Other raw material markets are following - a few laggards to watch
While each commodity has idiosyncratic characteristics for its supply and demand equations, the common theme pushing prices into the stratosphere is rising inflationary pressures that erode money’s purchasing power.
While lumber, palladium, and copper all hit new record level over the past weeks, other commodities are threatening to do the same. The continuous corn futures contract reached the most recent high at $7.75 per bushel this month. The all-time high was in 2012 at $8.5475. Nearby soybeans futures rallied to $16.7725, with the 2012 record peak at $17.9475 per bushel. Other agricultural commodities including, wheat, sugar, and coffee futures, recently traded at or near multi-year highs.
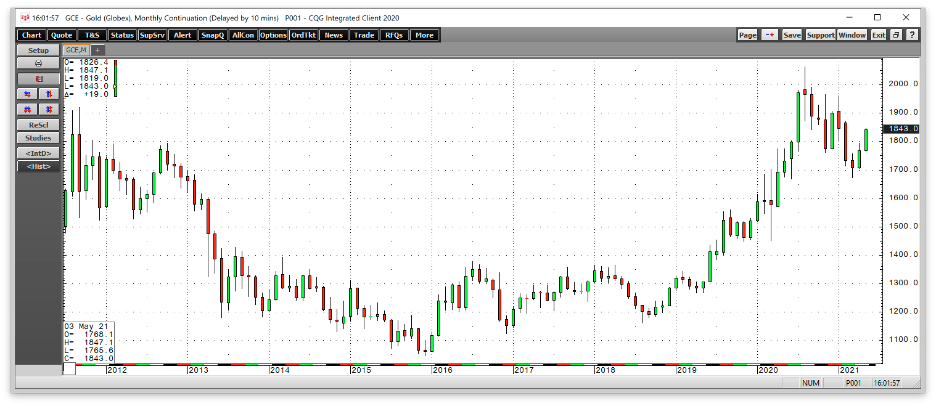
Gold reached its record high at $2063 in August 2020. The yellow metal with a long history as an inflation barometer reached an all-time peak in US dollar terms and virtually all other currencies. After pulling back to a low of $1673.30 in early March, gold began making higher lows and higher highs over the past weeks.
Source: CQG
As the monthly chart shows, gold futures were back near the $1840 level at the end of last week. If the price action in other commodities is a guide, gold could head for a challenge of last year’s peak and reach new record heights. Silver and platinum are also candidates for price appreciation in the current environment. Moreover, crude oil and other energy commodities have been trending higher. While the oil price remains well below the $100 per barrel level, ethanol recently reached its highest price since 2014; the last time petroleum prices were in the triple digits.
Inflation may not be quite so “transitory” based on the price action in the commodities asset class. Prices are rising, and liquidity and stimulus continue to pour fuel on the bullish fire.
