After taking a severe blow last year in the middle of the global pandemic, oil and gas stocks are roaring back.

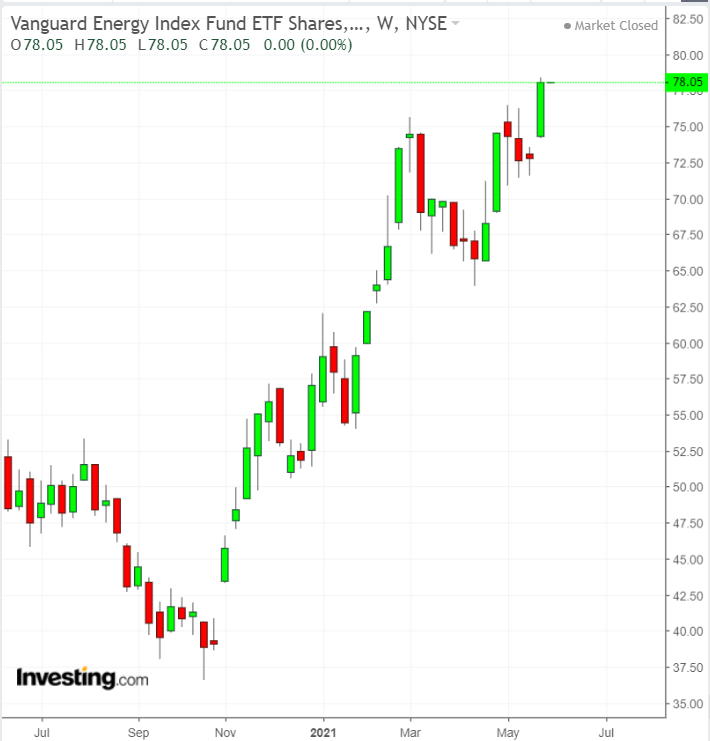
The Vanguard Energy Index Fund ETF Shares (NYSE:VDE)—whose top 10 holdings include Exxon Mobil (NYSE:XOM), Chevron (NYSE:CVX) and Phillips 66 (NYSE:PSX)—has massively outperformed the S&P 500 this year. It’s surged 49% compared with the benchmark stock index, which has gained just over 12%.
This powerful rebound—in one of the worst sectors of the market last year—comes amid very strong signs that the economic reopening in the U.S. and other economies will continue to fuel demand for energy products, bolstering the financial situation of some of the largest oil companies.
The U.S. economy, after a successful vaccine drive, was close to its pre-pandemic size by the end of the first-quarter, and economists expect growth to pick up further in the current quarter. Brent crude closed on Friday at a two-year high, while WTI crude rose to levels not seen since October of 2018.
The cartel of oil producing nations, known as OPEC+ group, said this past week in their forecast that oil demand would jump by six million barrels a day in the second half. As a result, global oil stocks will fall below their five-year average for the 2015-2019 period by the end of July, signaling an end to the pandemic glut.
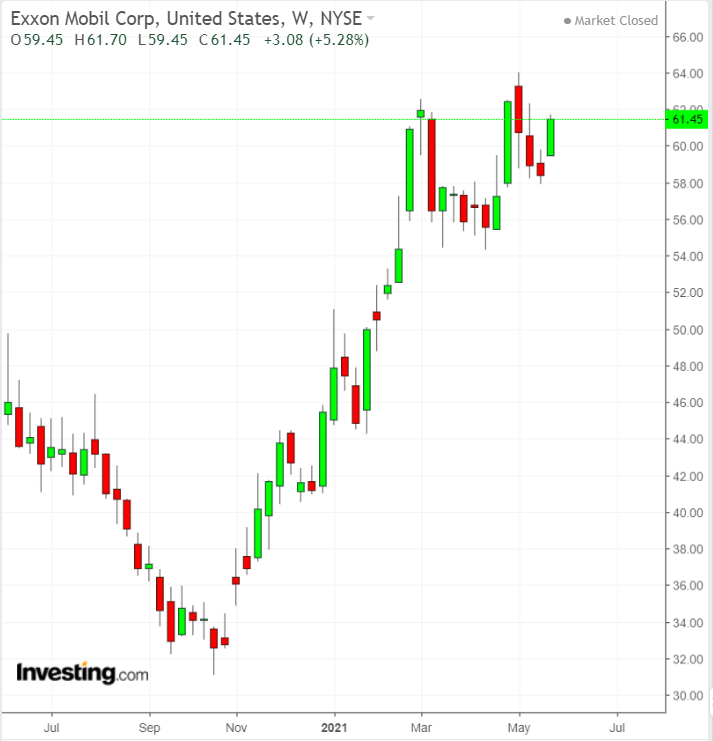
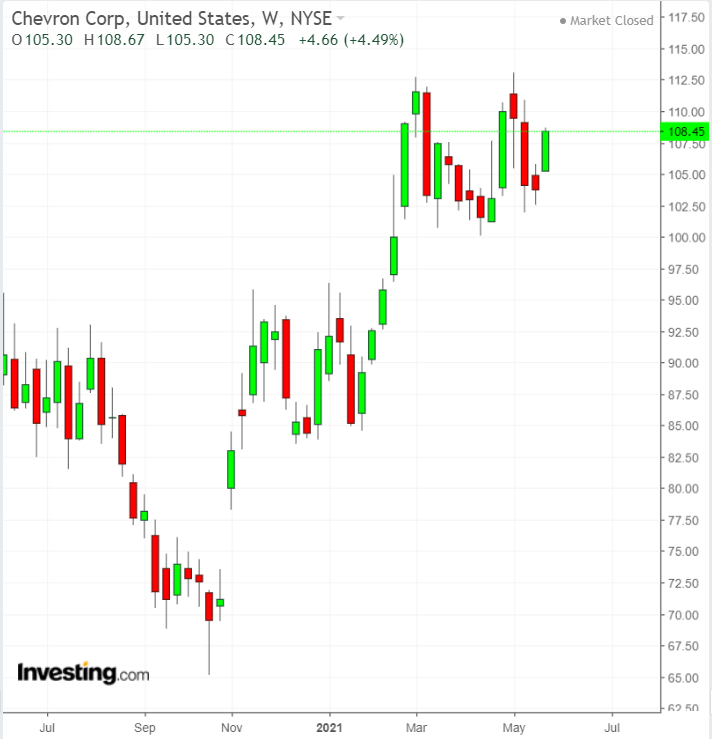
As energy demand recovers quickly, some of the biggest oil stocks have regained their lost ground. Closing at $61.45 on Friday, Exxon has soared 49% this year, while another oil super major, Chevron, is up about 28% during the same period.
Bargain To Yield-Hungry Investors

While the best time to buy quality oil stocks is certainly behind us in the current cycle, some of these names are still offering a bargain to yield-hungry investors. Exxon’s 5.7% annual dividend yield, for example, is four times bigger than the S&P-500’s average yield.
With the swelling demand for energy, these companies are also in a much better position to cover their payouts from their cash generation than borrowing from the market. Exxon generated $6.6 billion in free cash flows during the first-quarter—the amount which was enough to cover dividends for the first time since the fall of 2018 and was higher than the prior nine quarters combined.

Improving margins also helped Chevron to hike its quarterly dividend by 4%, while Royal Dutch Shell (NYSE:RDSa) also raised its dividend 4%, the second increase since slashing it last year. Some analysts believe there is more upside in the current run-up in oil prices.
Market fundamentals are strong and oil prices could climb to $80 a barrel by the middle of the third quarter in the absence of Iranian supplies, Fereidun Fesharaki, the chairman of industry consultant FGE, told Bloomberg Television last week.
Goldman Sachs forecasts WTI averaging $72.50 per barrel during the second quarter, before climbing to $77 during the third quarter. The firm sees Brent at $75 during the second quarter before advancing to $80 during the second half of the year.
Bottom Line
The global economic recovery may continue to support higher oil prices and shares of some of the largest oil companies in the second half of this year. That favorable outlook suggests that there is more upside in these cyclical stocks, such as Exxon and Chevron, which still offer some of the highest dividend yields.
