
- XLE has moved appreciably higher in 2022
- Falling stock market
- Higher interest rates, rising dollar not typically bullish for energy commodities
- Addressing climate change does not support fossil fuels
- 3 factors will continue to push XLE higher
Crude oil, natural gas and coal prices have increased appreciably from the 2020 lows. In April 2020, nearby NYMEX crude oil prices fell to the lowest level in history as the expiring contract fell below zero to negative $40.32 per barrel. Brent futures dropped to $16 per barrel, the lowest price this century. Natural gas reached a 25-year low of $1.44 per MMBtu in June 2020, and thermal coal for delivery in Rotterdam dropped to $38.45 per ton in April 2020.
Since then, prices have exploded higher, with oil and gas reaching the highest prices since 2008. Coal and oil product prices have reached new record levels as the fossil fuel price implosions of 2020 turned into explosions in 2022.
Companies that extract hydrocarbons from the Earth’s crust are experiencing a profit bonanza, even as the overall stock market has become a falling knife. After lagging the stock market for years, traditional energy companies have become the leader, posting gains as the rest of the stock market falls.
The S&P 500 Energy Sector SPDR (NYSE:XLE) holds a portfolio of the leading U.S. traditional energy companies. It has been the place to be in 2022 while the stock market continues to correct. The energy sector has declined with the stock market in the past, but 2022 is no ordinary year.
XLE Has Moved Appreciably Higher In 2022
After reaching the lowest level since August 2003 at $22.88 per share in March 2020, the XLE ETF has made higher lows and higher highs.

Source: Barchart
The chart highlights the ascent of the traditional energy sector ETF. In March 2022, the XLE eclipsed the May 2018 high. After closing at the $55.50 level on Dec. 31, 2021, more than double the price at the March 2020 low, the XLE traded to a high of $88.77 on May 27, 2022, a 59.9% rise. The XLE closed at the $88.53 per share level on Friday, May 27.
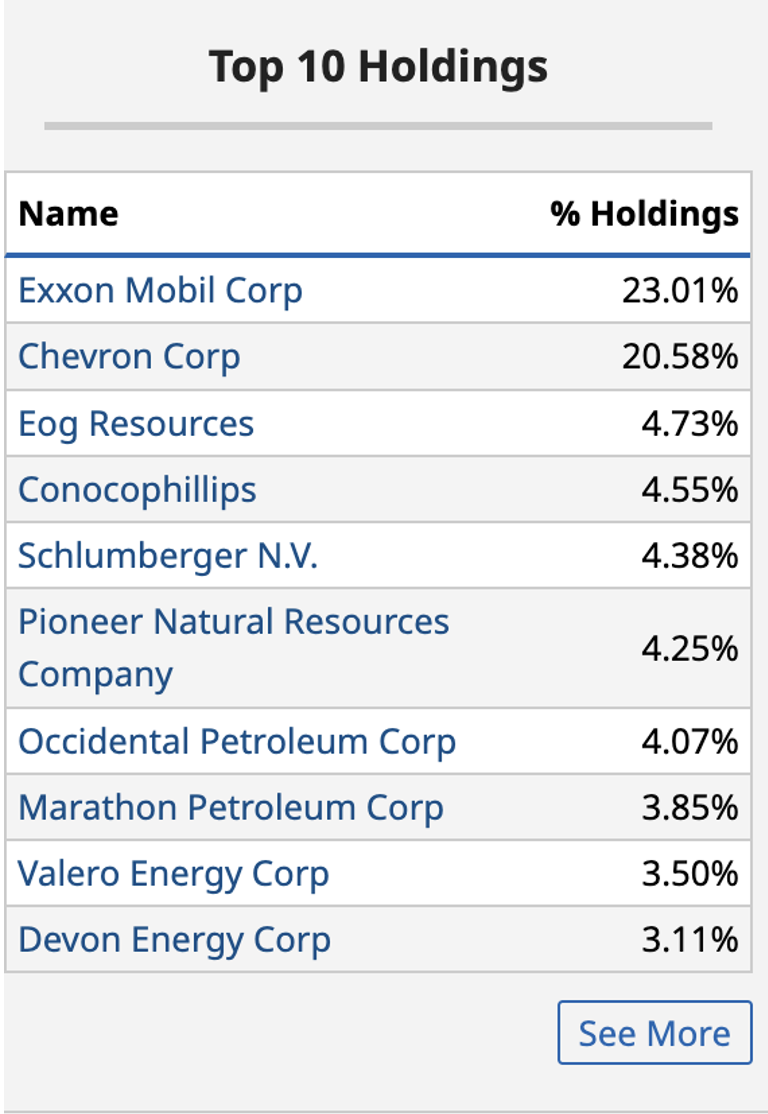
The XLE holds the top U.S. oil and gas-related companies. The top 10 holdings include:
Source: Barchart
The ETF has more than 43.5% exposure to the two leading U.S. integrated oil and gas companies: Exxon Mobile (NYSE:XOM) and Chevron (NYSE:CVX).
Falling Stock Market
In 2022, the ascent of the XLE has been particularly impressive, given the decline in the leading U.S. stock market indices.

Source: Barchart
The chart highlights the decline in the S&P 500, the most diversified U.S. stock market index. The index declined from 4,766.18 on Dec. 31, 2021, to the 4,158.24 level on May 27, a 12.8% drop. The tech-heavy NASDAQ Composite and small-cap Russell 2000 indices have done even worse than the S&P 500. Energy has been an oasis for investors during the current stock market correction.
Higher Interest Rates, Rising Dollar Not Typically Bullish For Energy Commodities
Historically, rising interest rates and a strong U.S. dollar weighed on commodity prices, and energy is no exception. Higher rates increase financing costs and inventory expenses. The U.S. dollar is the world’s reserve currency and the pricing benchmark for most raw materials. As the dollar’s value rises, it causes prices to increase in other foreign exchange instruments.
Meanwhile, 2022 is anything but an ordinary year. Rising inflation is pushing production costs higher. The war in Ukraine has made oil and gas weapons in an economic conflict between Russia, with Chinese support, against the U.S., Europe, and their allies. Oil and natural gas prices have soared in 2022.

Source: Barchart
The chart shows the increase in nearby NYMEX crude oil futures from $75.21 at the end of 2021 to the $116.17 per barrel level on May 30, a 54.5% rise.

Source: Barchart
Nearby natural gas prices moved from $3.73 on Dec. 31, 2021, to the $8.70 per MMBtu level on May 30, or over 133% higher.
NYMEX crude oil reached a high of $130.50 per barrel in March, and natural gas futures climbed to $9.447 per MMBtu last week. The all-time 2008 peak in NYMEX crude oil was at the $147.27 level, and natural gas peaked at $15.78 per MMBtu in 2005.
The bullish technical trends in the energy commodity continue to support higher prices. While crude oil and natural gas did not reach record highs as of May 27, gasoline and distillate prices have reached all-time peaks over the past weeks. European and Asian natural gas prices have also moved to historical highs. Petroleum and natural gas futures continue to trend towards a challenge of their all-time highs.
Addressing Climate Change Does Not Support Fossil Fuels
The shift in U.S. energy policy, favoring alternative and renewable fuels, has inhibited U.S. production. In March 2020, daily U.S. petroleum output reached a record 13.2 million barrels per day. According to the US Energy Information Administration, production stood at the 11.9 mbpd level as of May 20. U.S. energy policy is addressing climate change, but the world continues to depend on hydrocarbons for power and fuel.
Meanwhile, the shift in U.S. policy handed oil’s pricing power back to OPEC, the international oil cartel. Over the past years, Russia became an influential OPEC partner, cooperating on production and pricing policies. While the U.S. was the world’s leading petroleum producer in March 2020, the leadership baton now sits in Riyadh, Saudi Arabia, and Moscow. European dependence on Russian natural gas flows allows Moscow to use the energy commodity as a tool in the economic conflict with the west.
Sky-high oil and gas prices are funding Russia’s war against Ukraine. Over the past weeks, Saudi Aramco (TADAWUL:2222) surpassed Apple (NASDAQ:AAPL) as the publicly traded company with the highest market cap. Aramco trades on the Saudi stock exchange.
The shift in U.S. energy policy creates a virtual monopoly for the leading U.S. integrated oil and gas companies. Increased regulations and other factors create entry barriers for any new companies in the traditional energy sector.
3 Factors Will Continue To Push XLE Higher
As of May 27, the path of least resistance for XLE remains higher. The next technical target for the ETF stands at the 2014, $101.52 all-time high. The XLE ETF has a $41.728-billion market cap and trades an average of over 37.2 million shares each day.
The fund charges a 0.10% management fee and pays shareholders a blended $2.52 annual dividend, translating to a 2.85% yield. XLE has provided market participants with the best of both worlds in a falling stock market—capital appreciation and an above-market yield.
Three factors should continue to push the XLE higher towards a test of the 2014 high:
- Oil and gas prices are in bullish technical trends with new record highs on the horizon.
- The war in Europe has made oil and gas economic tools. OPEC and Russia are likely to continue to squeeze the U.S. and European consumers over the coming months.
- The world runs on oil and gas, and the U.S. energy policy will take decades to transform energy dependence to alternative and renewable fuels.
In a falling stock market, the XLE has been a star performer. Bull and bear markets rarely move in straight lines, and corrections can be brutal. I will be a buyer of the XLE on price dips as the prospects for oil and gas prices continue to point to higher lows and higher highs.
***
Interested in finding your next great stock or ETF idea? InvestingPro+ gives you the chance to screen through 135K+ stocks to find the fastest growing or most undervalued stocks in the world, with professional data, tools, and insights. Learn More »