
This article was written exclusively for Investing.com
- The digital currency revolution reflects the evolution of money
- Libertarian money: a threat to government control
- Crypto rush like the California gold rush; number of tokens keeps rising—there is gold in them there clouds
- XinFin (XDC) is the 66th leading crypto
- Decentraland (MANA) is 72nd
In April and May 2021, the market cap of all cryptocurrencies floating around in cyberspace rose to around the $2.5 trillion level. After virtually halving in value, it was back near the $2 trillion level as of Aug. 17.
Bitcoin fell from $65,520 on the nearby futures contract on Apr. 14 to a low of $28,800 in late June. Ethereum, the second-leading asset class member, nosedived from $4,406.50 to $1,697.75 from the May high to the June low. The volatility in the asset class is not for the faint of heart. Head spinning moves are the norm, not the exception.
Volatility creates a nightmare for passive investors. Meanwhile, the price swings create a paradise of opportunity for traders with their fingers on the pulse of markets.
With approximately 11,290 tokens to choose from, trading requires critical mass. Only 70 tokens—or 0.62% of the market—have market caps around the $1.50 billion level or above. A sufficient market cap is a requirement for liquidity. The higher the market cap, the more likely bid-offer spreads are tight enough to allow for easy execution on the buy- and sell-side.
XinFin (XDC) and Decentraland (MANA) are cryptocurrencies that are reasonable candidates for trading as they are members of the elite class near or above $1.5 billion in value as of Aug. 17.
The digital currency revolution reflects the evolution of money
The range in nearby Bitcoin futures in 2021 has been from $28,440 to $65,520 per token. At the $45,690 level on Aug. 17, the leading cryptocurrency was trading near the midpoint after a parabolic rally and brutal correction.
Ethereum futures began trading in February and have been as high as $4,406.50 and as low as $1,371. At the $3,150 level, the crypto with the second-leading market cap was above its midpoint value.
The trend in cryptocurrencies remains higher. At the end of 2020, the asset class’s market cap stood at $767.5 billion. On Aug. 17, it was almost triple that level at just below the $2 trillion. While that seems enormous, there is plenty of room for growth—Apple (NASDAQ:AAPL) had a market cap of $2.498 trillion on Aug. 17.
The ascent of digital currency values reflects the evolution of the fintech revolution. Libertarians who believe in individual freedom have embraced the asset class.
It removes control of the money supply from governments and central banks and hands it back to the people. The bottom line is bids and offers in the market determine cryptocurrency values, while governments and central banks can issue fiat currencies to their heart’s content.
Libertarian money: a threat to government control
There is broad acceptance and a wide embrace for blockchain technology as it increases the speed of transactions while providing efficiency in record keeping. However, the cryptos pose a substantial threat to governments’ control of money, which is a key source of power.
Controlling the purse strings is a critical factor for any leader. Surrendering that control diminishes the role of governments, central banks, and monetary authorities worldwide.
As the digital asset class’s market cap rises, expect governments to become more concerned. Regulations and bans could be on the horizon. Thomas Jefferson said:
“I believe banking institutions are more dangerous to our liberties than standing armies.”
Clearly, one of the US's founding fathers would likely be a crypto proponent.
Meanwhile, central bankers and government officials continue to point to the shady side of the cryptocurrency markets. However, the comments likely are spurred by a fear of losing control and power.
Crypto rush like the gold rush; number of tokens keeps rising—there is gold in them there clouds
While libertarians embrace cryptos as an ideological imperative, many market participants view the market as a treasure hunt for the next token that will deliver incredible gains and spectacular wealth.
The burgeoning asset class has been around for a little over a decade. The speculative fervor that has gripped the market reminds me of the US gold rush in 1850 when prospectors flocked west to find “gold in them there hills.”
Now, instead of physical labor, there's an army of miners using energy resources as they search to unlock complicated computer codes that deliver Bitcoin and other tokens. The crypto rush continues. At the end of 2020, 8,153 tokens were floating around in cyberspace. On Aug. 17, the number was nearly 38.5% higher at 11,290. Each day, new tokens come to market with new opportunities for speculators looking for the next Bitcoin, Ethereum, or other cryptos that have soared.
The volatile nature of the asset class makes for dangerous investing but many trading opportunities. Only invest capital you are willing to lose as many of the tokens will wind up as worthless dust collectors in computer wallets.
Traders should look for tokens with critical mass as only the cryptos with substantial market caps will offer liquidity via tight bid-offer spreads. XDC and MANA are tokens with market caps that make them candidates for trading opportunities.
XinFin: the 66th leading crypto
XinFin (XDC) was trading at the $0.1502 per token level on Aug. 19 with a market cap of $1.836 billion. XinFin is an enterprise-ready hybrid technology company optimized for international trade and finance. XDC is the native token.
The protocol supports smart contracts. XinFin’s website states it is a “Decentralized, Hybrid, Interoperable & Liquid Network.”

Source, all charts: CoinMarketCap
As the chart highlights, XDC has traded between $0.0036 and $0.1504 per token since April 2018. At the $0.1502 level, the token is sitting at the high.
Decentraland is 72nd
At $0.777 on Aug. 19, Decentraland (MANA) was the 72nd leading cryptocurrency with a near-$1.500 billion market cap. MANA is the digital token that is the currency for goods and services in Decentraland, built on Ethereum under ERC20 standards.
ERC 20 is the standard for creating and issuing smart contracts on Ethereum’s blockchain. Decentraland’s website states it is the “first-ever virtual world owned by its users.”
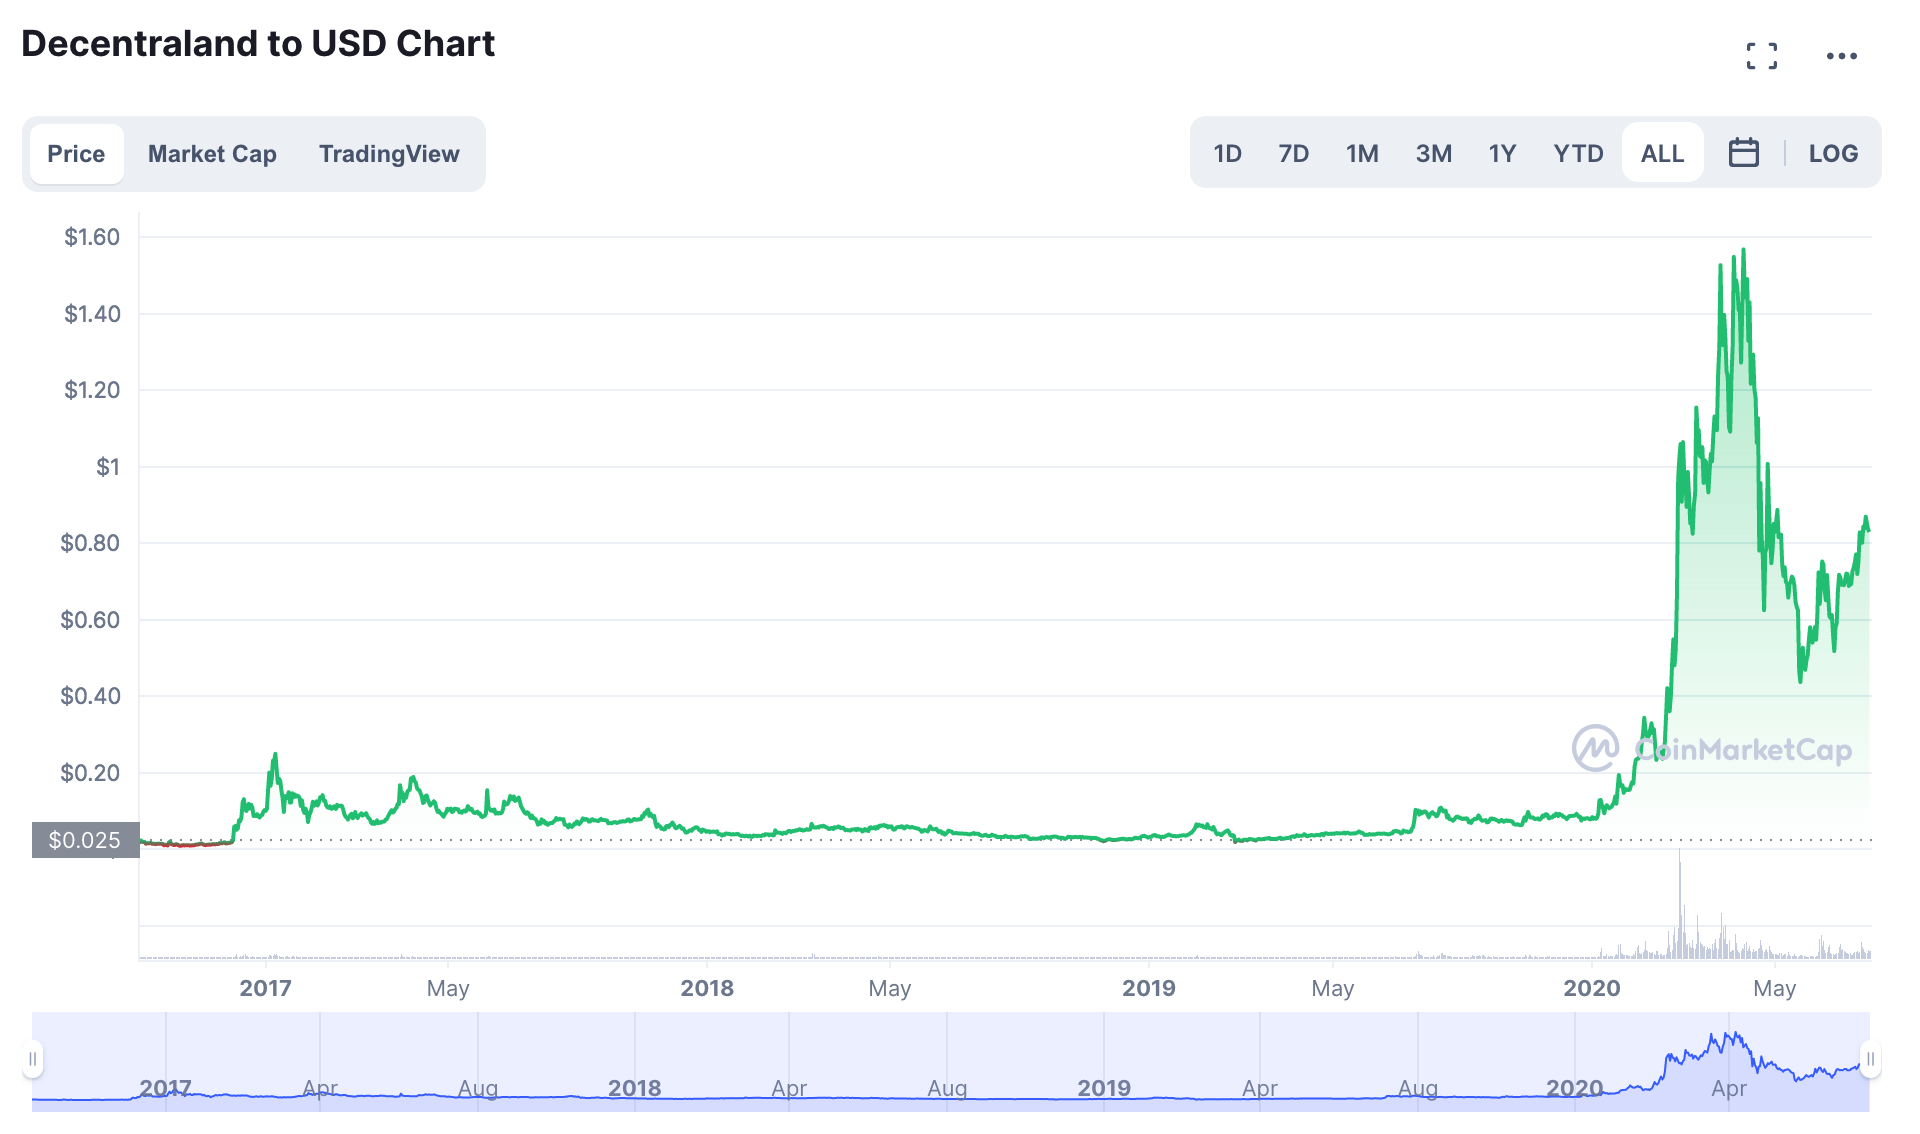
The chart illustrates the range from below $0.014 to $1.57 per token since September 2017. The token was above the midpoint of the trading range at the $0.777 level on Aug. 19.
At the 66th and 72nd positions in the cryptocurrency hierarchy, XDC and MANA are in the top 0.62% of the asset class.
With market caps around the $1.5 billion level, the two cryptos have critical mass for trading. However, bids or offers for XDC and MANA could evaporate in volatile conditions as the markets are still immature. The recovery in cryptocurrencies from the low in June will increase speculation as market participants continue to pan for riches in cyberspace.