Whether its energy, metals or edibles, the 2021 commodities rally has been remarkable for its breadth and depth, covering almost every sphere of the raw materials sector, and producing double-digit gains on many markets.
The under-reported but overachiever is probably cotton—a commodity essentially produced for its fibre, and used universally as a textile raw material.
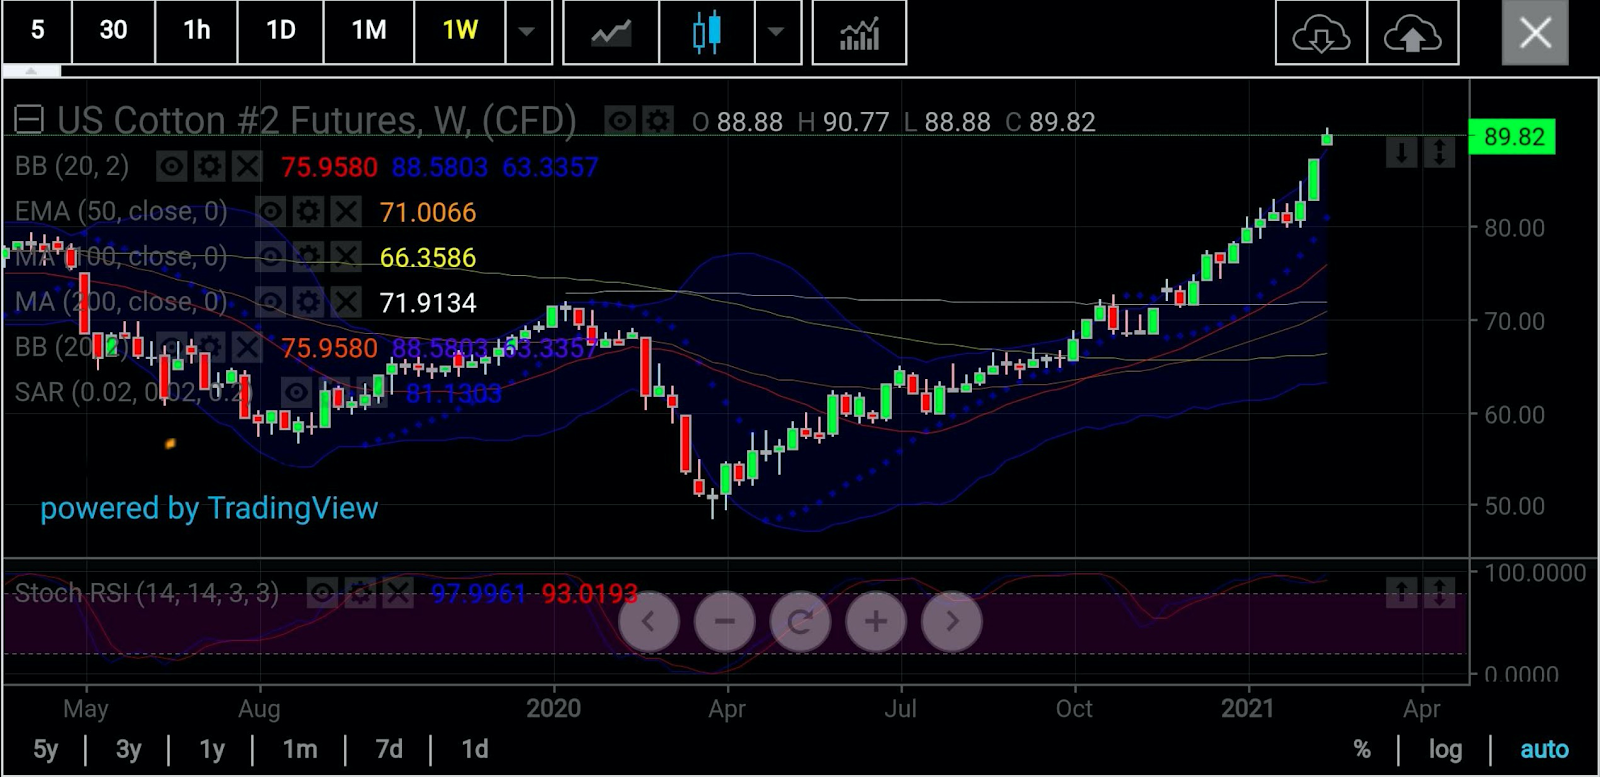
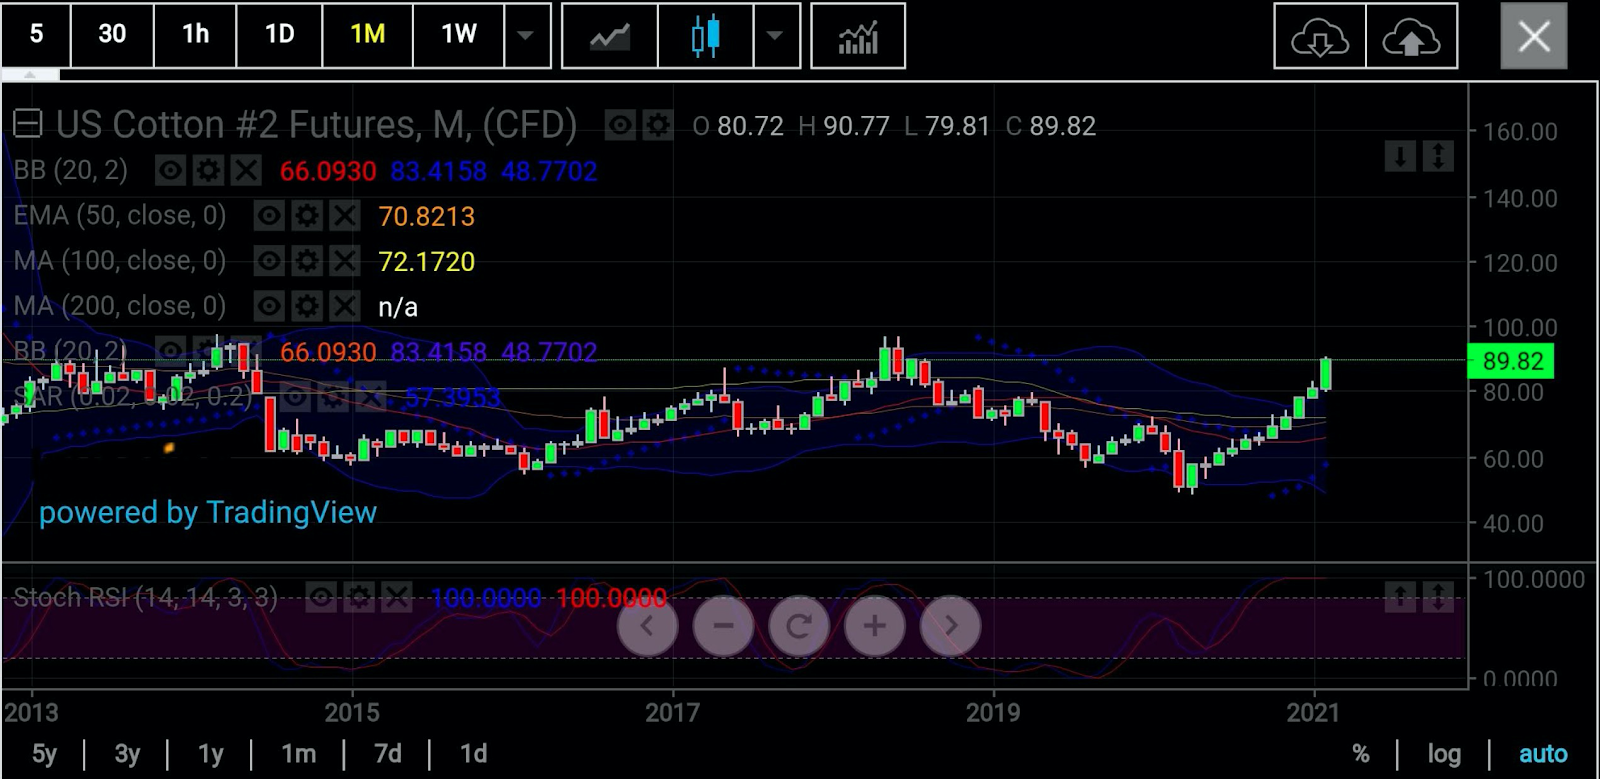
The cotton market on US ICE Futures is having a phenomenal February, gaining almost 12%, its largest advance in a month since its July 2016 rally of 15%. At this month’s peak of 90.77 cents per lb, ICE cotton also reached its highest price since July 2018.
Pandemic Barely Hurt Cotton Prices
The run-up in cotton actually began almost a year ago, from the end of March 2020, when it settled at just under 51.15 cents a lb. From there, it surged some 77% to Friday’s rate of around 90.65 cents. Along the way, it only finished one month in the red—May, where it dipped 0.3%.
That effectively meant that the near year-long coronavirus pandemic barely weighed on cotton prices, an industrial raw material whose demand can be used to measure economic performance, just like copper.
Copper futures on New York’s COMEX have actually had a more enduring run through the upheavals of COVID-19, ending in the red in only three of the past 18 months.
Copper’s rise from $2.60 per lb in August 2019 to $3.92 on Friday means an investor who had maintained a long position in the commodity through that stretch would be up 50% now. Like cotton, copper also returned 75% on investment over the past year.
What sets the two apart is their profile. Copper, used in everything from mammoth power turbines to the micro-circuits of cellphones, is never short of headlines. It’s the No. 1 base metal that the whole world, especially China, is after.
The ‘Quiet’ Industrial Workhorse
Cotton, a critical ingredient in garments, bedding and soft furnishings, remains the “quiet workhorse” of the industrial commodities space—under-reported despite its epic returns over the past year.
Andy Hecht, a commodities contributor on Investing.com, noted that the rally in cotton could also be signaling accelerating inflationary pressures as more and more currency has been required to purchase a pound of the fluffy fiber since April last year.
Jack Scoville, who heads plantation research for the Price Futures Group brokerage in Chicago, says he does not expect industrial uptake for cotton to ebb anytime soon.
He adds:
“Demand has been strong even with the coronavirus around and getting worse. The overall weaker US dollar has helped demand ideas as well, although the dollar has started to firm recently. The US stock market has been generally firm to help support ideas of a better economy here and potentially increased demand for cotton products.”
Grown in more than 100 countries and with over 150 countries involved in its import and export, cotton is critical to the world economy. The six largest consuming countries are also among the top seven producing countries. It also accounts for about 30% of the world trade.
Scoville also said cotton production was forecast to fall in the most recent production report from the US Department of Agriculture, due to competition from prices of another rallying crop, sorghum. So, cotton supplies could turn tight if demand remains strong, he said, adding:
“Talk is around regarding the planted area for the next crop. Producers in Texas might decide to plant sorghum instead of cotton due to the relatively strong prices in sorghum. Chinese demand for sorghum has been very strong to cause the higher prices.”
Higher World Trade, Sales Seen
The US National Cotton Council(NCC) expects the 2021 cotton acreage to shrink by 5.2% this year to 11.5 million acres, NCC vice president of economics and policy analysis Jody Campiche said last week.
Campiche added:
“World trade is estimated to be higher in the 2020 marketing year as consumption recovers from the COVID-19 pandemic. Based on sales and shipments for the year-to-date, US exports are projected to reach 15.8 million bales in the 2020 marketing year. “
“As a result of large carryover sales from the 2019 crop year and increased purchases from China, U.S. export commitments and shipments have been very strong for the 2020 crop year. Current commitments are at the highest level at this point in the marketing year since the 2010 crop year.”
Campiche also said that while export competition from Brazil remains strong, the United States was able to regain market share in China in 2020 as a result of the 2020 US-Sino trade agreement.
The United States also had increased opportunities for higher export sales to other markets in the 2020 crop year due to lower production in Australia, Pakistan, and Turkey, despite exports projected to drop slightly to 15.4 million bales in the 2021 marketing year, Campiche added.

All charts courtesy of SK Dixit Charting
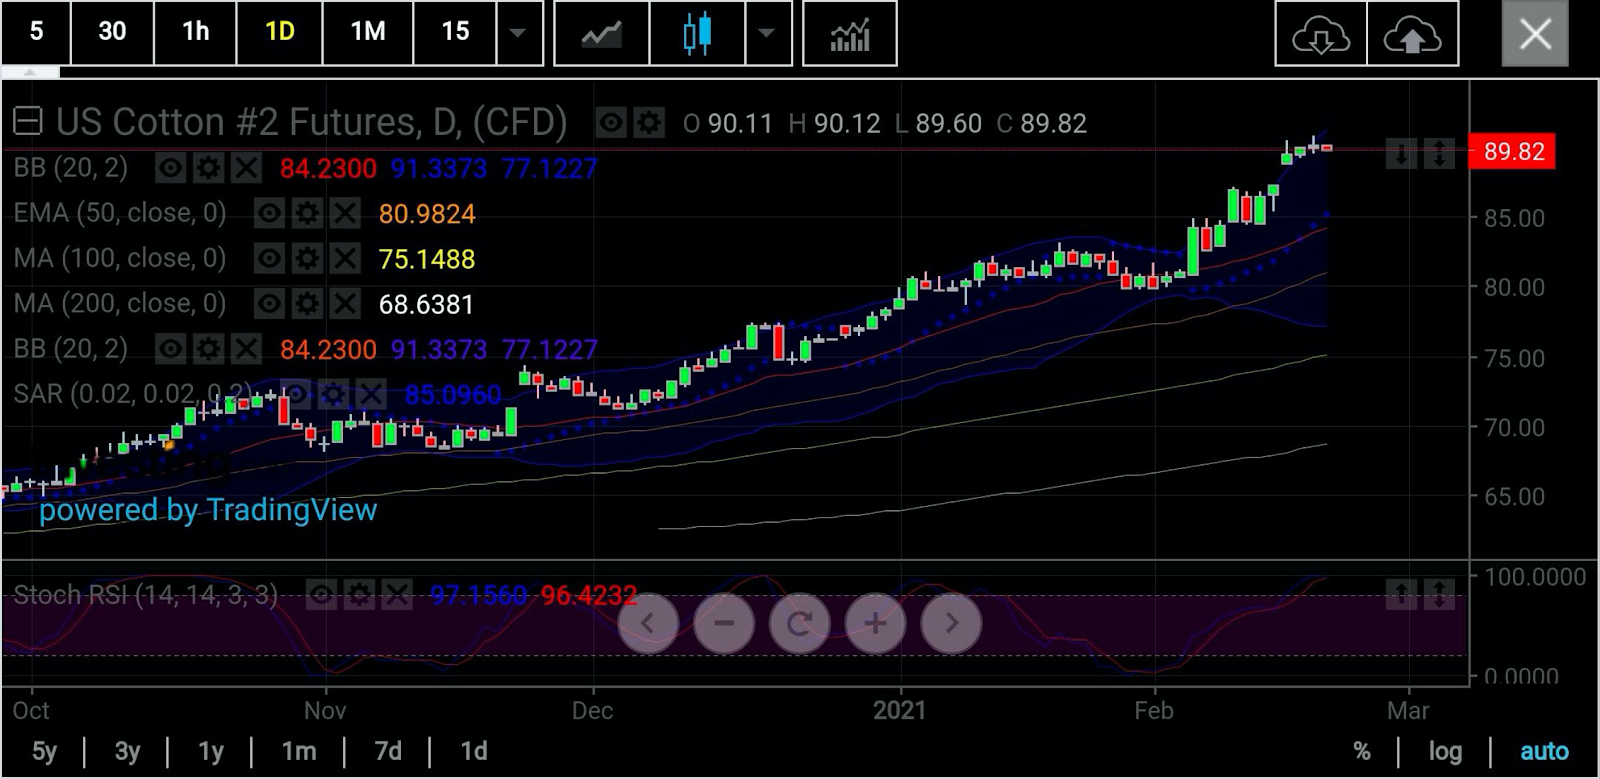
On the technical front, cotton’s front-month May contract on ICE (NYSE:ICE) Futures US looks poised to maintain its current upward momentum to reach highs above 97 cents per lb, said Sunil Kumar Dixit of SK Dixit Charting in Kolkata, India.
But this could come after some consolidation too, he said, adding:
“May cotton’s daily charts have a gap significant enough to warrant a pull back to fill the gap between 88.88 - 87.32.”
“Post gap fill up move, consolidation above 86 areas may resume the next leg higher leading to June 2018 close of 93. 09 and high of 96.49.”

Dixit also said any weakness below 85 cents could trigger profit-booking, exposing May cotton to lower areas of 83.09 - 79.89.
He stresses:
“On short term as well as mid to long term horizon technical indicators and oscillators point to very bullish scenarios. However, the gap calls for caution.”

Disclaimer: Barani Krishnan uses a range of views outside his own to bring diversity to his analysis of any market. As an analyst for Investing.com he presents divergent views and market variables.
Comments are welcome and encouraged. Inappropriate comments will be reported and removed.
