Blockbuster U.S. draws have helped crude prices go strong late into the summer. But production is also up stealthily year-on-year, despite a sheer drop in the U.S. oil rig count—a less scrutinized development that could get more attention if shale drillers make a vigorous comeback.
As oil bulls look eagerly for another U.S. crude inventory decline to add to the near 15 million barrels in draws over the past two weeks, which would show ramping demand, the fact remains that crude’s fundamentals would be in much better shape if production was falling just as steeply.
U.S. Oil Output Startlingly High Despite Rigs Collapse
Industry firm Baker Hughes’ survey of the U.S. oil drilling landscape last week showed the number of actively-deployed rigs fell by 4 to reach 738, the lowest since early January 2018.
Strikingly, U.S. crude production remains in an overall uptrend, setting new records on a weekly basis. Total output is about 12.7% above where it stood the same week a year ago. The U.S. Energy Information Administration latest weekly dataset shows production at 12.4 million bpd, just inches away from its all-time record high.
Bulls Should Be Mindful Of Shale’s Efficiency
For a greater perspective, the U.S. upstream sector has 54% fewer drilling rigs than the 1,609 deployed during the highs of October 2014, but the country is producing 3,525,000 bpd (39.7%) more oil than it was five years ago.
In October 2014, 5,515.85 bpd were being produced for each rig deployed. In contrast, as of Friday, 16,802 bpd per rig were being produced.
It’s a tale that once again highlights the incredible technology behind hydraulic fracturing, or ‘fracking’—the prime mover behind shale.
Given that the decline in the rig count might be plateauing, it would serve OPEC and the bull camp well to keep this efficiency in perspective, even as they try to talk down the threat to high prices from shale.
OPEC, ECB On The Radar
This week, OPEC’s Joint Ministerial Monitoring Committee meets in Abu Dhabi to review the supply cuts of 1.2 million barrels per day that the cartel and its key ally Russia have carried out since December.
After the review, the committee will also recommend to OPEC’s top leadership what else needs to be done to bolster oil prices. This can mean more market swings as traders try to interpret its words.

All charts powered by TradingView
Prices sealed their biggest weekly gain since July on Friday, after Federal Reserve chief Jerome Powell vowed to support U.S. economic growth—a hint to many that the central bank might cut rates again for the second time since July.
Even before the Fed’s decision at the end of its Sept. 17-18 meeting, the European Central Bank could cut rates this Thursday. An ECB rate reduction is widely forecast as part of a broader package to stimulate the Eurozone economy.
Lower Rates Key To Continued Rally In Oil, Gold
British newspaper The Guardian noted that Eurozone rates have been held near zero in recent years in an attempt to stimulate growth, and ECB chief Mario Draghi is expected to keep them low for longer to counter a weak manufacturing sector, uncertainty surrounding Brexit and the ongoing global trade war.
If the ECB does implement a rate cut, it would be a strong motivator for the Fed to follow with a 25 basis points decrease, similarly to what it did in July.
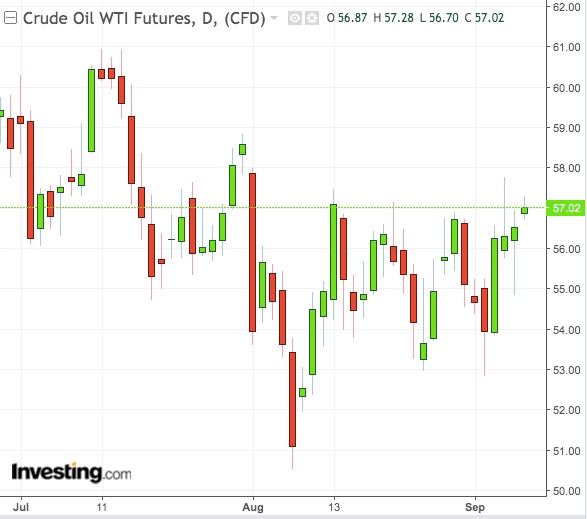
Lower rates would be positive for both oil and gold prices, also considering that, since August, crude oil has been whipsawed by volatility, with daily moves of more than 2% becoming the new normal.
New York-traded West Texas Intermediate crude, the U.S. benchmark blend, settled at $56.52 per barrel on Friday. For the week, it rose 2.6%, marking its biggest weekly advance since July.
London-traded Brent crude, the international benchmark blend, extended its perch above the key $60 level to $61.47.
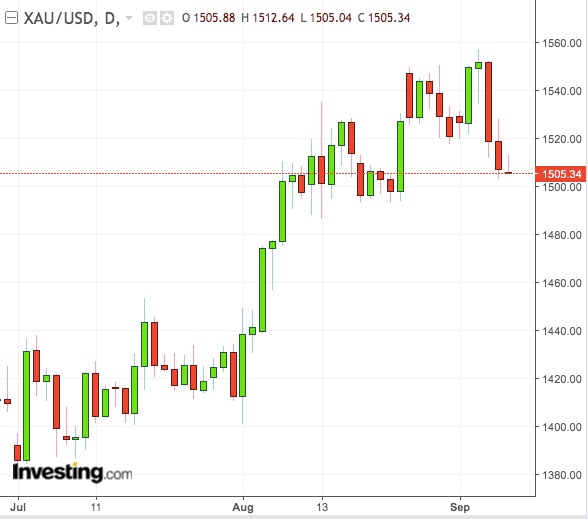
Gold’s key support at $1,500 ounce will depend much on a Fed cut—and the ECB decision will be the all-important precursor for the yellow metal this week.

Spot gold, reflective of trades in bullion, last traded at $1,507 per ounce on Friday, down 0.9% on the day after Powell also specified the most likely case for the U.S. was a continuation of moderate growth. On Thursday, it had lost 2.2%, for its largest one-day decline of the year.
Gold futures for December delivery settled at $1,515.50 per ounce on the Comex division of the New York Mercantile Exchange, also down 0.9% on the week.
