This article was written exclusively for Investing.com
- Soybeans break out to the upside
- Crush spreads reflect demand for soybean products
- The processing spread in soybeans rises to its highest level in two years
- Chinese demand for soybeans rises despite trade tensions with the US
- An almost perfect bullish storm for soybeans?
Over the past few years, soybeans have been the agricultural commodity squarely in the crosshairs of the trade war between the United States and China. After reaching a high of $10.71 per bushel in February 2018, the futures price of the oilseed that trades on the CME’s CBOT division fell to a low of $7.8050 in May 2019.
The US is the world’s leading producer and exporter of soybeans. Since China historically purchases one-quarter of the annual US crop, the trade spat created a glut of the oilseeds in the United States.
The fundamental equation for soybeans and all agricultural products is an expanding demand component. According to the US Census Bureau, each quarter, the global population grows by approximately twenty million people. The supply side depends on the weather conditions in critical growing regions.
In 2012, a drought lifted the price of nearby soybean futures to a record of $17.9475 per bushel. Over the past eight years, the weather cooperated with crop production, leading to bumper crops of soybeans and plenty of product to meet global requirements. But the trade war weighed on the price of the oilseeds.
After reaching the low in May 2019, soybean futures traded sideways with the price remaining below $9.50 per bushel until August 2020. Since then, the commodity has taken off to the upside, rising above the February 2018 high in October, during the current harvest season.
Soybeans break out to the upside
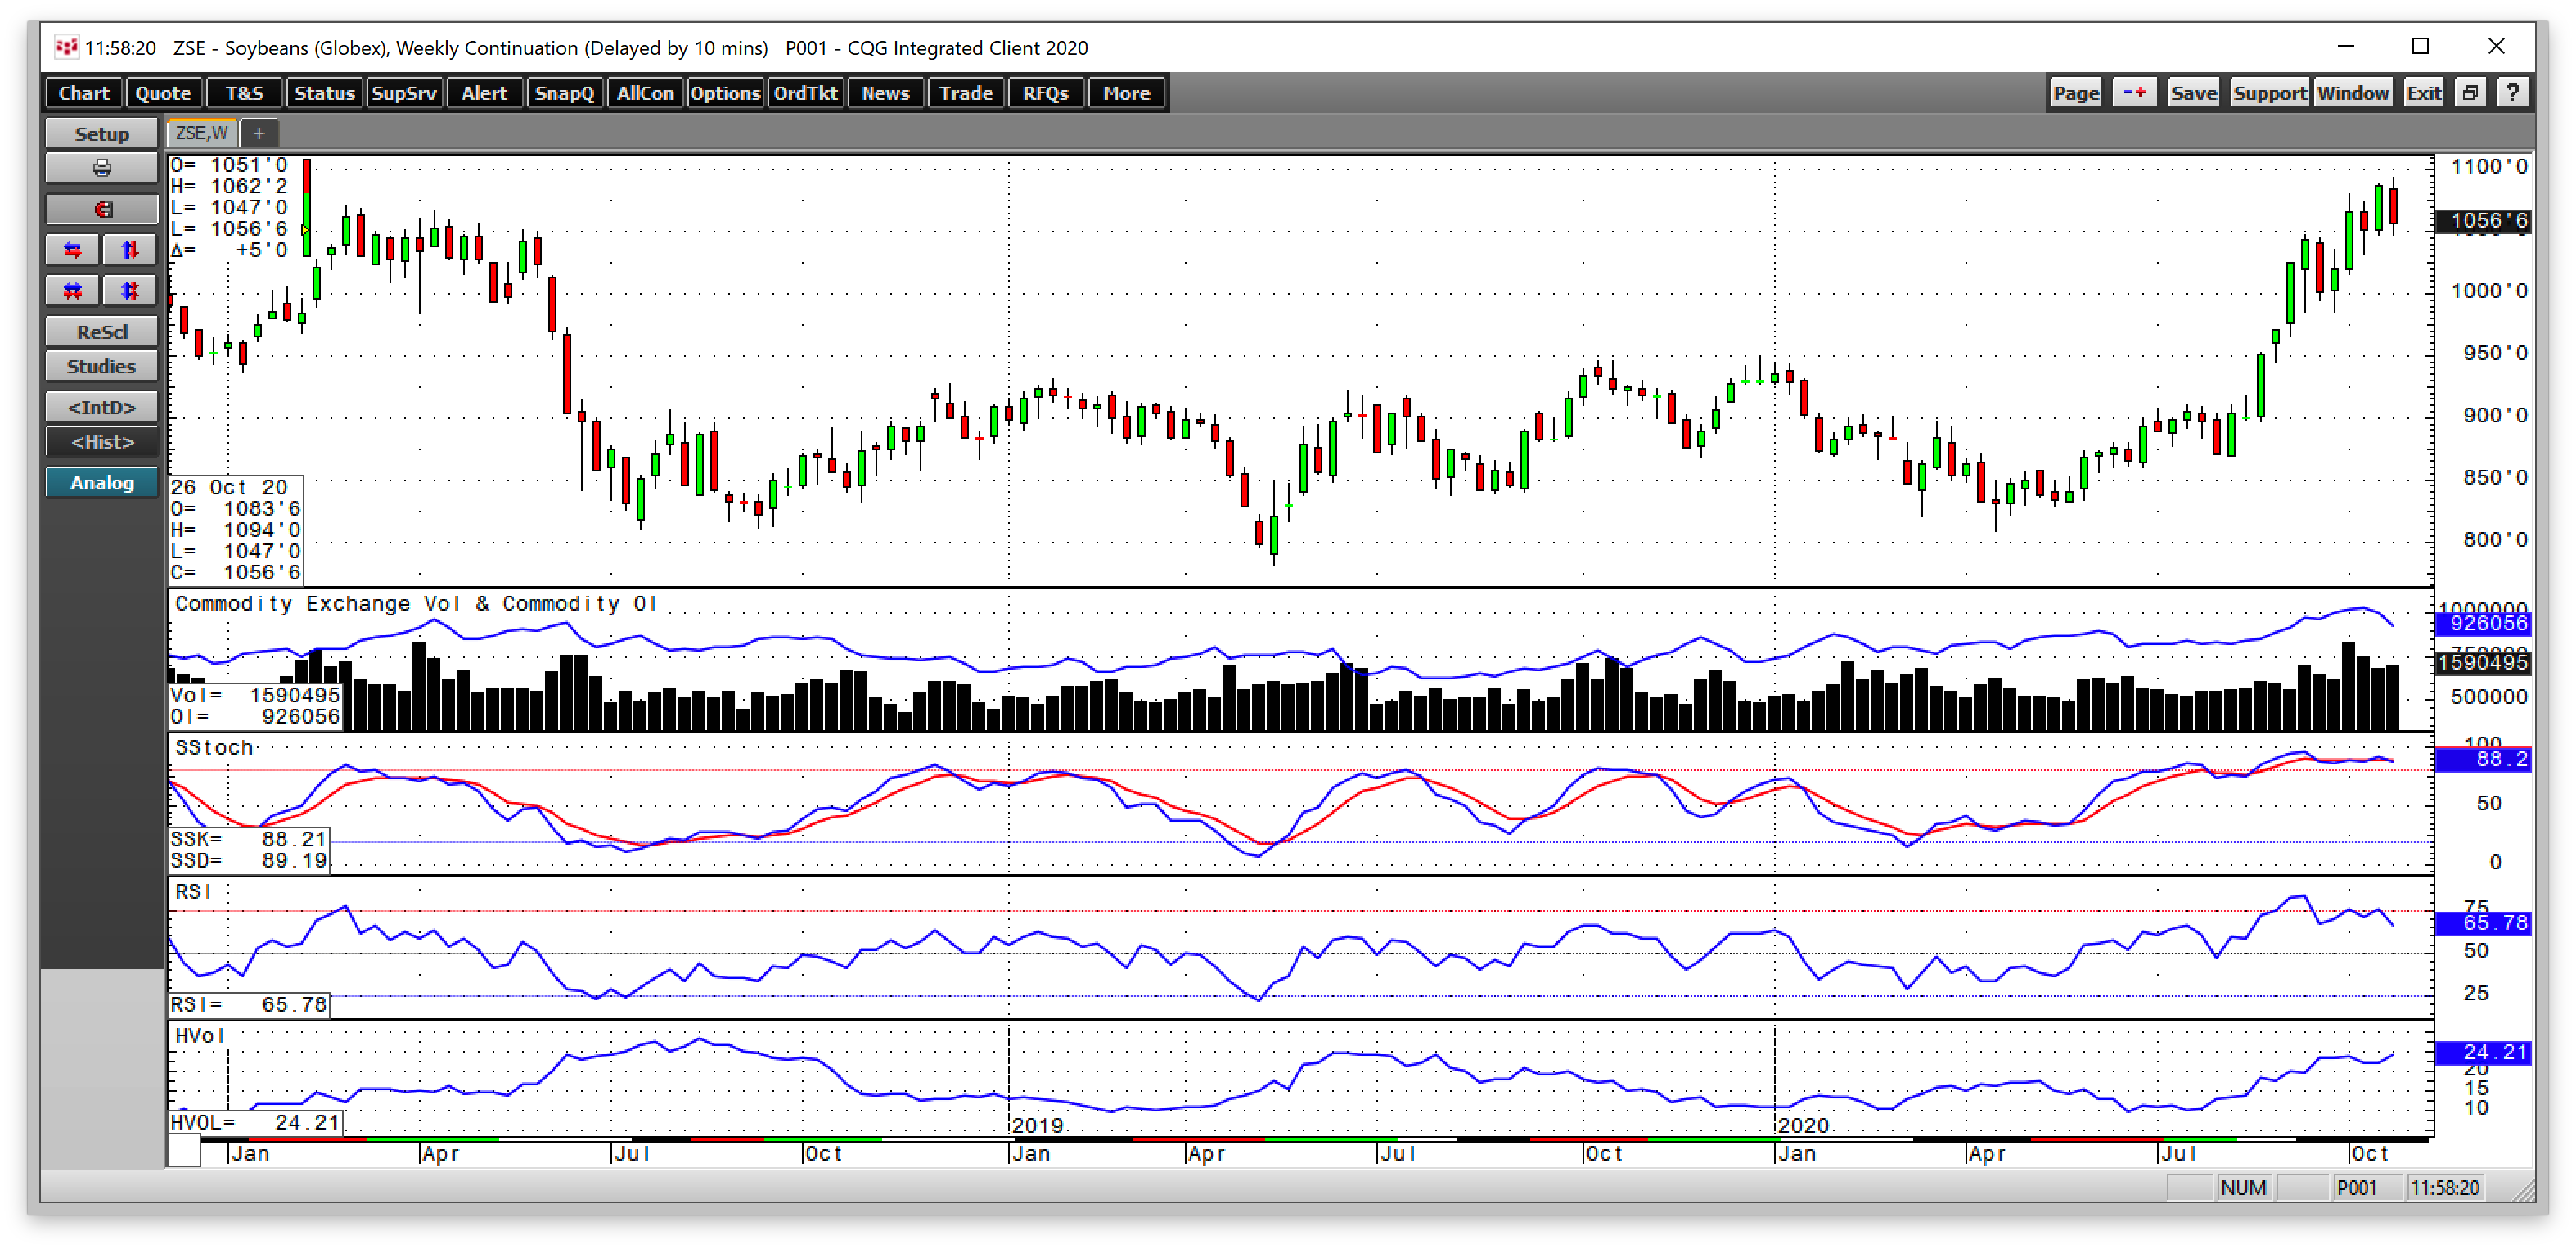
Soybean futures on the CME’s CBOT division have been making higher lows and higher highs since April when the price of November beans traded to a low of $8.3575 per bushel. The continuous contract hit bottom at $8.0825, which was the low for 2020. 
Source, all charts: CQG
As the weekly chart above shows, last week, soybean futures traded to the most recent high of $10.94 on the continuous contract. The high on January futures was at $10.8850 on Oct. 27.
The oilseed traded above the first level of technical resistance at $10.71, the March 2018 high, taking the commodity to the highest level since July 2016. The open interest metric climbed with the price, typically a technical validation of a bullish trend in a futures market.
Price momentum and relative strength indicators rose near overbought conditions. Weekly historical volatility at 24.21% is close to the high for 2020. The move in the price of soybeans was significant as it came at the end of this year’s harvest season.
Crush spreads reflect demand for soybean products
Soybeans are a staple source of nutrition. Processors crush the raw oilseed into soybean meal and soybean oil. The meal is a primary input in animal feed, while the oil has applications for cooking and is an ingredient in salad dressings, mayonnaise, and many other foods.
When the crush spread rises, it reflects increasing demand for soybeans. When it falls, it is a sign of oversupply or falling requirements.
The crush spread reflects the processing margin, just as crack spreads represent the demand for gasoline and distillate products in the crude oil market. Processing spreads are an integral part of a commodity’s market structure as they provide clues about the state of the supply and demand equation.
The processing spread in soybeans rises to its highest level in two years
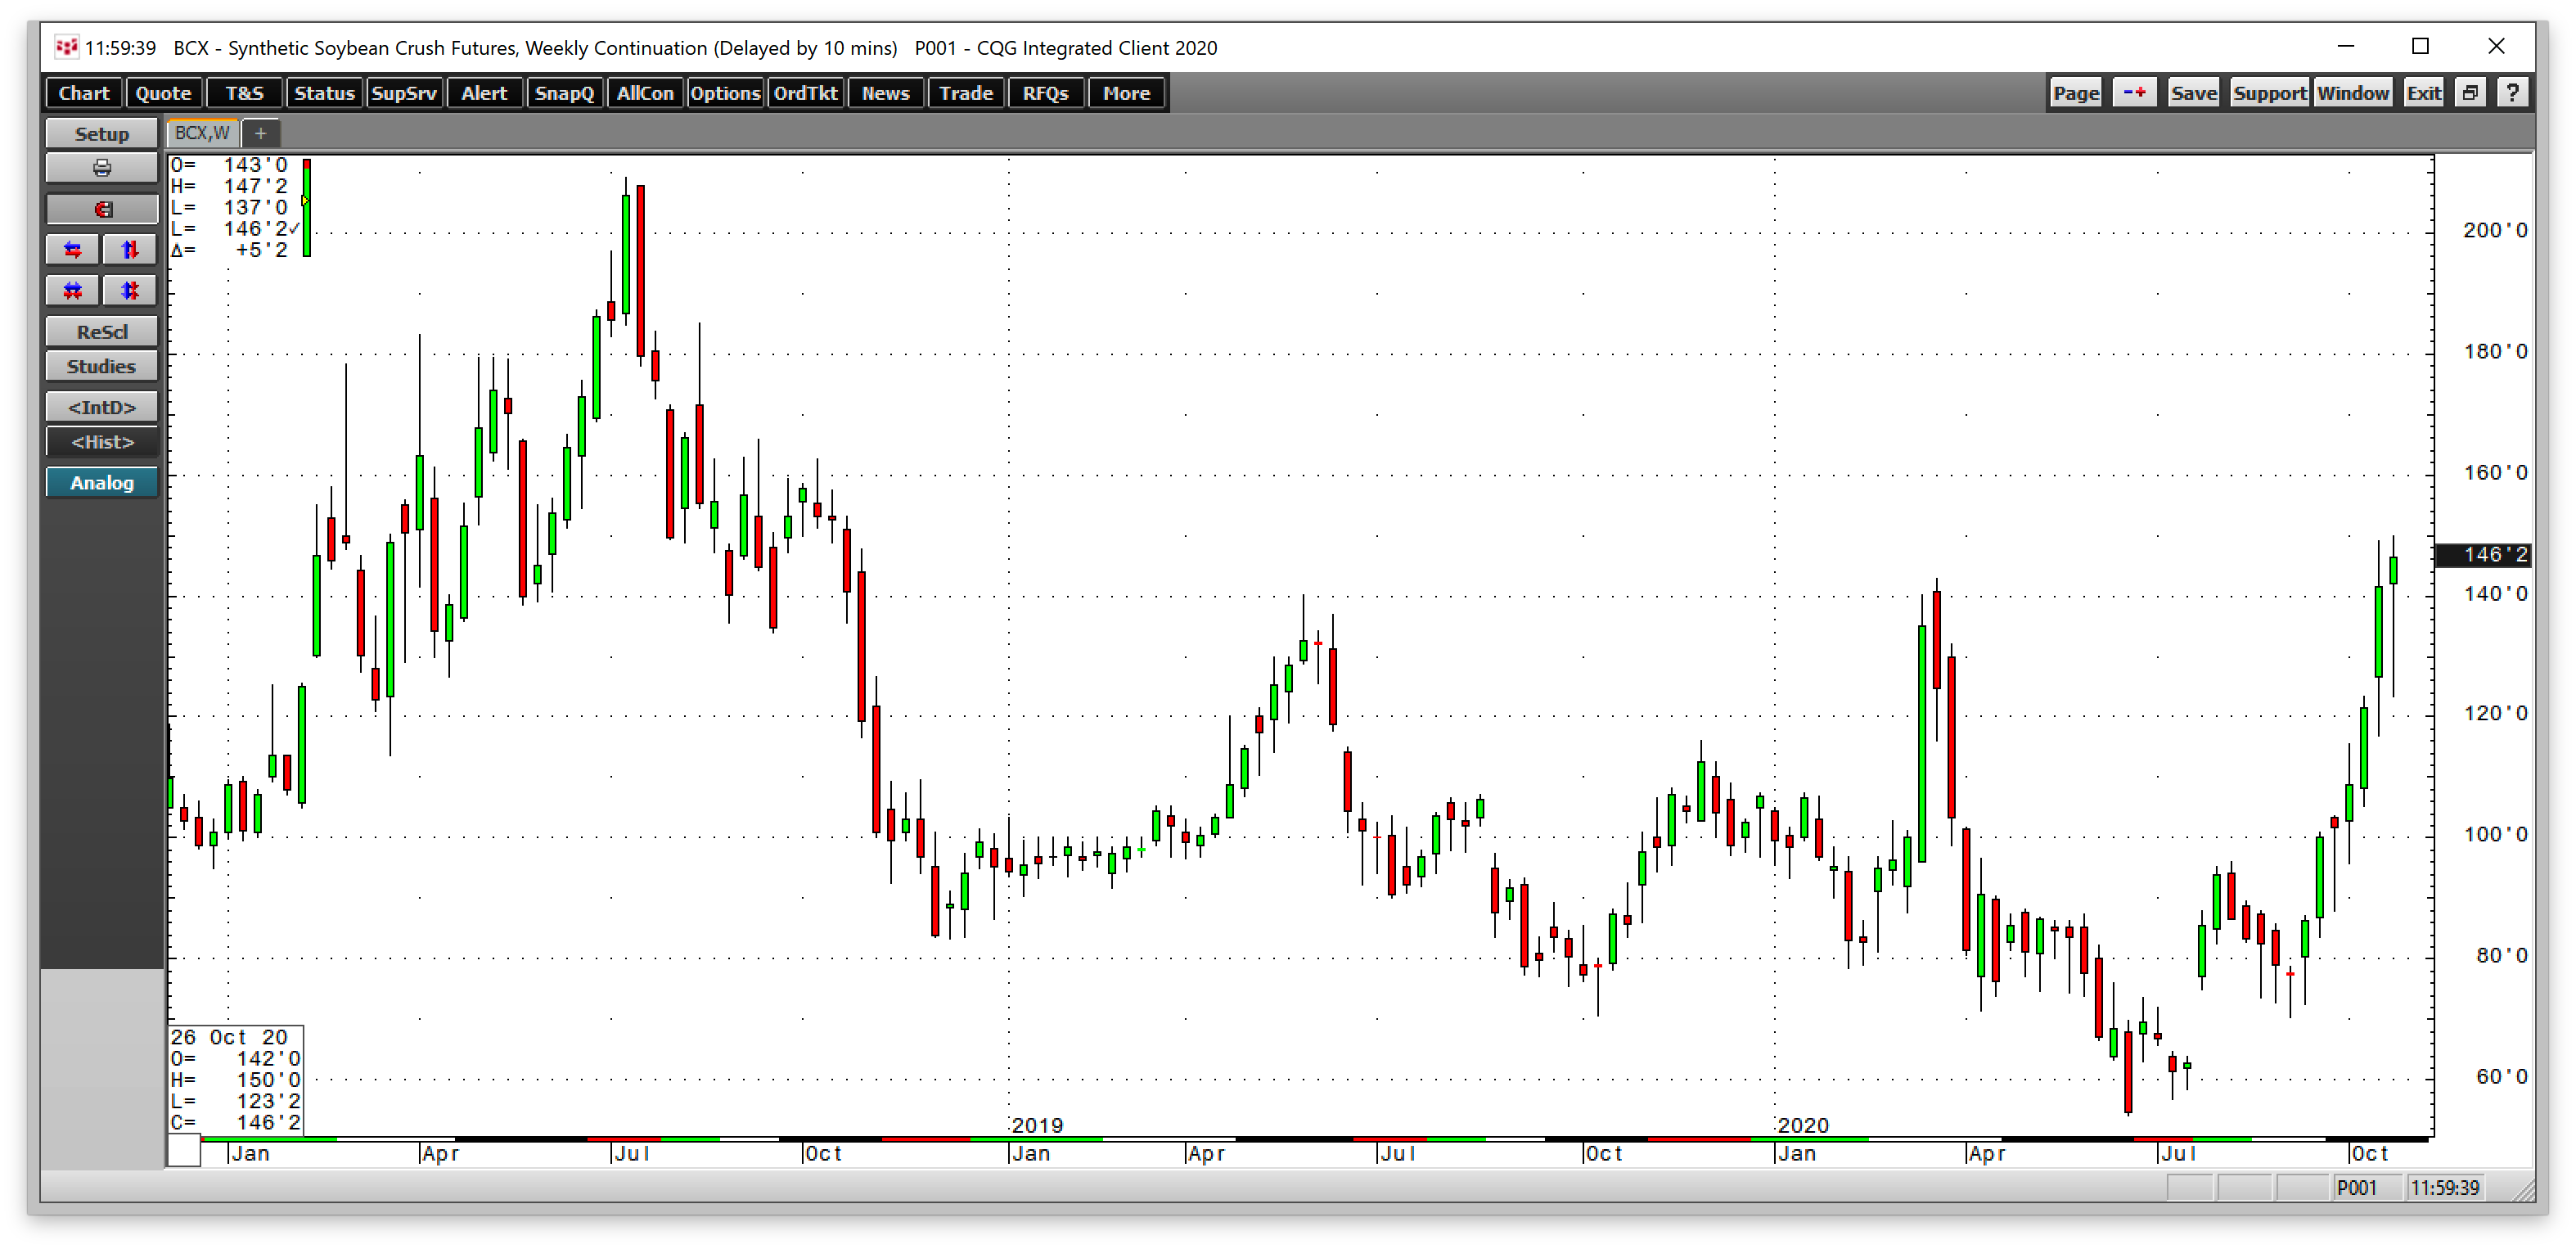
The move in the soybean crush spread has been highly supportive of the bullish price action in the oilseed futures. 
As the chart of the soybean crush spread shows, the processing margin rose from 54.25 cents in June to the latest high of $1.50 last week. The move higher in the spread means that soybean product prices outperformed the raw oilseed even though soybean futures prices rose over the past months. The crush spread moved to the highest level since October 2018, which has been bullish for the soybean price.
Chinese demand for soybeans rises despite trade tensions with the US
Over the past weeks, China has made several “huge purchases” of US soybeans. The purchases reflect China’s efforts to meet its import commitments under the “phase one” trade agreement signed in January 2020.
The Chinese have been rebuilding their hog population after it was ravaged by African Swine Fever in 2019, which has increased the demand for animal feed and soybean meal. The USDA recently reported 2020/2021 soybean export sales to China totaling 19.241 million tons as of Sept. 17, compared with only 2.0549 million tons by the same date for delivery in 2019/2020. Over ten million tons of outstanding sales to “unknown destinations” could be heading for China.
The trade war caused China to turn to Brazil for the bulk of its soybean requirements. However, Brazil is now entering the new crop year. With COVID-19 raging in the South American country and the weather a critical factor, China may need to purchase even more beans from the US over the coming months despite the ongoing trade frictions.
An almost perfect bullish storm for soybeans?
If the weather below the equator over the coming weeks and months does not cooperate, soybean futures could be heading a lot higher. Meanwhile, overall weakness in the US dollar, unprecedented central bank liquidity, and the prospects for more government stimulus over the coming months increase the money supply and weigh on the value of the dollar and other fiat currencies. As the purchasing power of the foreign exchange instruments declines, the potential for higher commodity prices rises, and soybeans are no exception.
Soybeans have been making higher lows and higher highs over the past months. After breaking out above critical technical resistance at the $10.71 level, the next upside target stands at the June 2016 high of $12.0850 per bushel.
The January futures contract settled at the $10.5625 level last Friday. The oilseed price pulled back at the end of October, but the bullish trend remains intact.
