New Zealand’s dollar slumped after a weakening in inflation expectations spurred bets on a rate cut tomorrow. Taking a longer view, however, the market will soon make up its mind between a potential reversal in the medium-term and a continued long-term uptick since the mid-2014 bottom.

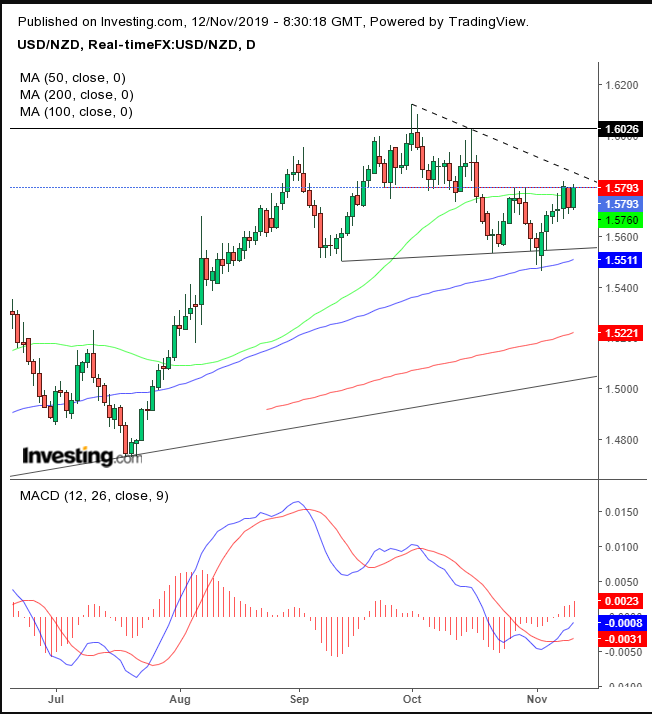
The USDNZD pair has been trading in a H&S top since the Sept. 3 high. If the pattern completes, with a downside breakdown of its neckline at 1.55, it will attract a further selloff, which will in turn retest the 200 DMA and below it the uptrend line since April at 1.5000.

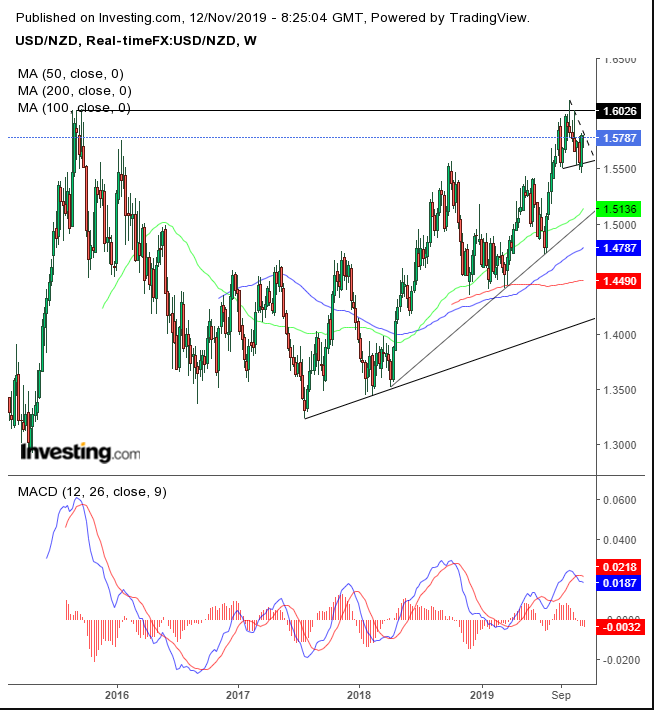
That expectation may be strengthened by a long-term view, in which the pair is developing a bearish pattern after the head tested the 1.6026 price, which resulted in a four-day decline. That price level is the late-2015 peak, which followed the dollar surge after the 2008 crash. It was the highest point for the pair prior to 2019.
On the other hand, continued global demand for U.S. Treasurys is anticipated, keeping appetite for the USD high. This could push the USDNZD past the pattern’s head. Blowing out any pattern tends to throw prices in the opposite direction of their initial path. Doing so on a multi-year resistance level is likely to compound that technical breaking point, with dramatic headlines attracting investors' attention.
The weekly MACD provided a sell signal, made powerful by its cresting well before the October peak, when the price registered significantly lower, providing a negative divergence.
Both trends have a claim. But while we don't know which will win, we can provide our probability-based perspective — what to pay attention to, for further evidence of which trend may triumph.
If the price closes above the falling (dotted) trendline between the head and the right shoulder, the chances increase for a blowout. A close below 1.5500, below the 100 DMA “guarding” the neckline, would boost the outlook for a reversal and for the price to fall toward the uptrend line above 1.5000.
Trading Strategies
Conservative traders would wait for the price to retest the 200 DMA, currently at 1.5221, then wait for a full return move and successfully retest the neckline, which would prove a resistance.
Moderate traders would be content with a close below the Nov. 4 low.
Aggressive traders may short now, taking advantage of a price smacked against its resistance since the Oct. 28, 1.5790 high.
Trade Sample – Short Position Setup
Note: A sample is just a sample. Overall successful trading requires maintaining the discipline to adhere to a set of rules for consistency.
