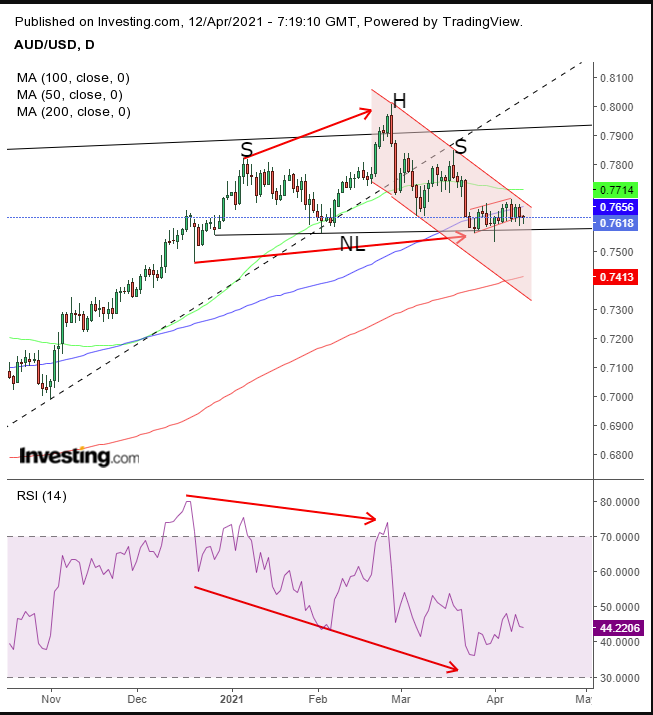
As it revelaed in its semi-annual financial stability review last week, The Reserve Bank of Australia is anxious about growing risks to the country’s economy. The central bank maintains that “rising prices are still consistent with low interest rates.”
Nonetheless, the RBA will keep monitoring the swelling price of homes. Policymakers are increasingly anxious about a negative divergence currently occuring in the country's real estate arena—excessive borrowing risk in the domestic housing market while office property vacancies increase.
An additional divergence: falling rental fees compared to rising home prices. This data suggests that the 0.1% interest rate is incentivizing Australians to buy homes, pushing house prices higher, while at the same time the lower demand for rentals pressured rental rates lower, a clear indicator of a housing bubble.
Also, concurrently, from a technical perspective, Aussie risk is to the downside.

The AUD/USD pair just completed a rising flag after a 170-pip plunge in two sessions, leading up to a pause. The range has been rising but in a highly congested fashion. This pattern suggests a short squeeze by early bears which new short sellers resisted, curtailing the gains.
The fact that the pattern developed within a falling channel, and on the neckline of a H&S top, suggests it is on the cusp of a downside breakout, leading to a reversal. The RSI has been providing a negative divergence, as rising prices since December have not had the support of momentum.
This often happens ahead a selloff. The bulls who carried prices higher since the Oct. 30 bottom suddenly notice that, much like cartoon characters, they're suddenly running in the air, with nothing to ground them, just before they plummet.
The entire flag developed after the preceding plunge fell below the 50 DMA. Today’s slight downside breakout followed the AUD to find resistance below the 100 DMA, which cut across the bearish pattern, over the past three days.
At the bottom of the falling channel waits the 200 DMA. Its role is to catch the falling price and throw it back up toward the channel top.
Trading Strategies
Conservative traders should wait for a downside breakout to include at least one long, red candle formed completely below the flag, then wait for a return move to find resistance below the flag, before entering a short position.
Moderate traders would wait to short, for the same obvious downside breakout and then may wait for another short squeeze, which speculative bulls might join, thereby breaking through the flag, for an entry closer to the resistance, not necessarily for added confirmation.
Aggressive traders could short at will, provided they accept the added risk for the added reward of getting ahead of the market. Money management becomes crucial, as the risk increases.
Here’s an example:
Trade Sample
- Entry: 0.7640
- Stop-Loss: 0.7660
- Risk: 20 pips
- Target: 0.7460
- Reward: 200 pips
- Risk:Reward Ratio: 1:10
