In this Chainlink (LINK) price prediction 2024, 2025-2030, we will analyze the price patterns of LINK by using accurate trader-friendly technical analysis indicators and predict the future movement of the cryptocurrency.
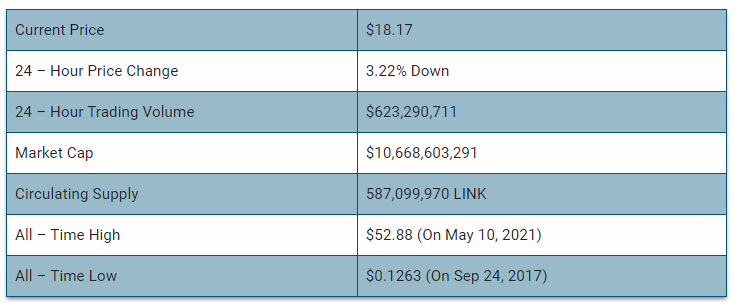
Chainlink (LINK) Current Market Status

(Source: CoinMarketCap)
What is Chainlink (LINK)

Chainlink is a blockchain-based cryptocurrency network. Chainlink provides a link between the real world and smart contracts. Multiple subcontracts can be generated in Chainlink, which also takes data from only the most trusted nodes and oracles for premium accuracy.
Moreover, LINK is the digital belonging token used to pay for services on the Chainlink network. LINK can be bought and sold for traditional currency or other digital currencies. Through cryptocurrency exchanges, LINK can be purchased and stored in a crypto wallet and custodian like Gemini.
Chainlink 24H Technicals
Chainlink (LINK) Price Prediction 2024
Chainlink (LINK) ranks 12th on CoinMarketCap in terms of its market capitalization. The overview of the Chainlink price prediction for 2024 is explained below with a daily time frame.
In the above chart, Chainlink (LINK) laid out a rising wedge pattern. A rising wedge pattern suggests a reversal pattern frequently seen in bear markets. The rising pattern shows up in charts when the price moves upward with pivot highs and lows converging toward a single point.
This pattern is made by drawing two trendlines, one trendline draws across two or more pivot highs, and the other one connects two or more pivot lows.
At the time of analysis, the price of Chainlink (LINK) was recorded at $18.829. If the pattern trend continues, then the price of LINK might reach the resistance level of 19.979. If the trend reverses, then the price of LINK may fall to the support of $17.584, $15.306, and $13.405.
Chainlink (LINK) Resistance and Support Levels
The chart given below elucidates the possible resistance and support levels of Chainlink (LINK) in 2024.
From the above chart, we can analyze and identify the following as resistance and support levels of Chainlink (LINK) for 2024.

Chainlink (LINK) Price Prediction 2024 — RVOL, MA, and RSI
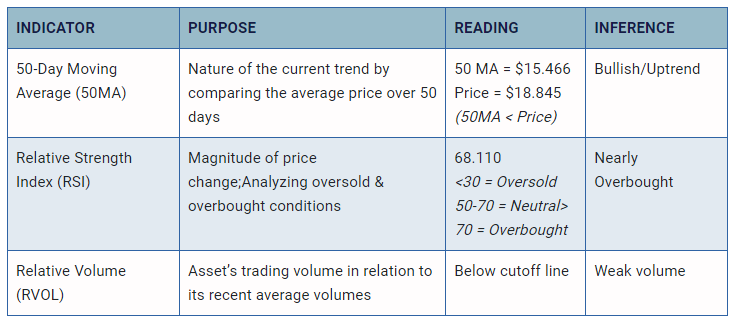
The technical analysis indicators such as Relative Volume (RVOL), Moving Average (MA), and Relative Strength Index (RSI) of Bitcoin (LINK) are shown in the chart below.
From the readings on the chart above, we can make the following inferences regarding the current Chainlink (LINK) market in 2024.

Chainlink (LINK) Price Prediction 2024 — ADX, RVI
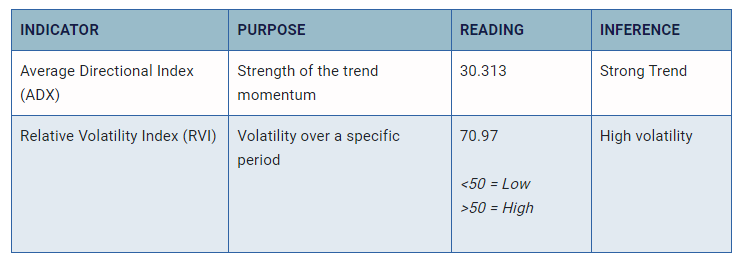
In the below chart, we analyze the strength and volatility of Chainlink (LINK) using the following technical analysis indicators — Average Directional Index (ADX) and Relative Volatility Index (RVI).
From the readings on the chart above, we can make the following inferences regarding the price momentum of Chainlink (LINK).

Comparison of LINK with BTC, ETH
Let us now compare the price movements of Chainlink (LINK) with that of Bitcoin (BTC), and Ethereum (ETH).
From the above chart, we can interpret that the price action of LINK is similar to that of BTC and ETH. That is, when the price of BTC and ETH increases or decreases, the price of LINK also increases or decreases respectively.
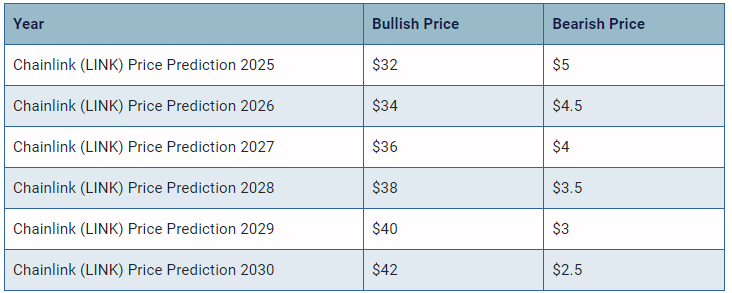
Chainlink (LINK) Price Prediction 2025, 2026 – 2030
With the help of the aforementioned technical analysis indicators and trend patterns, let us predict the price of Chainlink (LINK) between 2025, 2026, 2027, 2028, 2029 and 2030.

Conclusion
If Chainlink (LINK) establishes itself as a good investment in 2024, this year would be favorable to the cryptocurrency. In conclusion, the bullish Chainlink (LINK) price prediction for 2024 is $29.042. Comparatively, if unfavorable sentiment is triggered, the bearish Chainlink (LINK) price prediction for 2024 is $8.275.
If the market momentum and investors’ sentiment positively elevate, then Chainlink (LINK) might hit $30. Furthermore, with future upgrades and advancements in the Chainlink ecosystem, LINK might surpass its current all-time high (ATH) of $52.88. and mark its new ATH.
This content was originally published by our partners at The News Crypto.
