
- Despite all-time highs in major US indexes and gold, Bitcoin is lagging behind.
- The Bitcoin to S&P 500 ratio has been in bearish consolidation, indicating a divergence between the stock market recovery and cryptocurrency risk.
- Bitcoin must stay above the 50-day moving average to maintain bullish momentum, with a break below signaling a bearish outlook.
- For less than $9 a month, access our AI-powered ProPicks stock selection tool. Learn more here>>
Amid all-time highs from all the main US indexes, namely the S&P 500, NASDAQ Composite, and Dow Jones Industrial Average, as well as in the gold market, it seems like Bitcoin is the one assets trailing behind.
The two charts below can help illustrate my point. While the S&P 500 has been on a relentless long-term uptrend, the Bitcoin to S&P 500 ratio has traded in a bearish consolidation for the best part of this year.

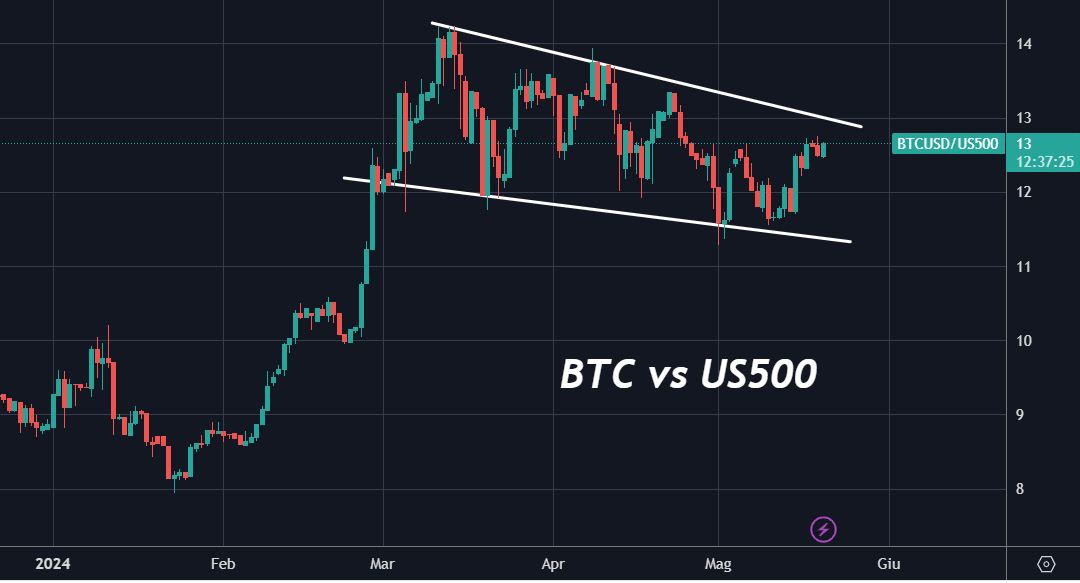
This divergence is quite interesting for an initial market analysis, as it highlights how the stock market's recovery has diverged from cryptocurrency risk. Unlike the major stock indices, Bitcoin is more than 8 percent below its previous highs, but a confirmed upward breakout could signal a new bullish trend.
Additionally, this development has several important implications:
- It suggests the continuation of the broader underperformance of cryptocurrencies. The breakout could indicate an increasing risk appetite during this rally, or perhaps a rise in overall investor risk tolerance.
- The bullish trend could boost investor confidence, potentially driving Bitcoin back to its previous highs.
- From a technical perspective, this could be seen as a continuation flag pattern, likely leading to a breakout and new cyclical highs. The BTC vs. S&P 500 ratios currently indicate a bullish trend, suggesting a general positive bias towards risky assets.
Technical View
At this stage, it is critical for BTC to stay above the 50-day moving average to maintain this momentum.
Bitcoin has decisively used the 50-period average over the past year and a half as dynamic support; each time it has recovered the average, it has been bullish, recording very positive performance.
Consequently, a break below this average would totally change the outlook, projecting it toward the 200-day moving average. Currently, Bitcoin is trading well above this level, supporting three theses:
- The angular amplitude of the 50- and 200-period averages confirms the bullish trend.
- If the price retests the 200-day average, it could serve as potential support.
- If the price falls below both the 50- and 200-day averages, it will be a strong bearish signal.
***
If you want to analyze more stocks, follow us in upcoming hands-on lessons, and subscribe now with an additional discount by clicking on the banner image below. 
Disclaimer: This article is written for informational purposes only; it does not constitute a solicitation, offer, advice, counsel or recommendation to invest as such it is not intended to incentivize the purchase of assets in any way. I would like to remind you that any type of asset, is evaluated from multiple points of view and is highly risky and therefore, any investment decision and the associated risk remains with the investor.