- Bitcoin surges back above $100,000 as inflation data boosts market optimism.
- New U.S. crypto regulations could fuel Bitcoin’s rally further.
- Key resistance at $102,450 could test Bitcoin’s bullish momentum.
- Kick off the new year with a portfolio built for volatility - subscribe now during our New Year’s Sale and get up to 50% off on InvestingPro!
Bitcoin’s recent surge has reversed last week’s downturn, propelling the cryptocurrency back into a positive trend.
As inflation data this week has cooled fears of a Fed rate hike, Bitcoin is now testing key resistance levels and trading above the $100,000 mark.
With macroeconomic data and a fresh push from key U.S. policies, the bulls have now set their sights on the next leg higher.
Inflation Data Ignites Market Optimism
This week’s U.S. inflation data is driving renewed optimism across markets. The Producer Price Index (PPI) came in below expectations, and the Consumer Price Index (CPI) for December met forecasts, offering relief to investors.
Though inflation is still above target, the downward trend has fueled speculation that the Fed might maintain a more relaxed policy into 2025.
This has lifted investor sentiment, easing concerns about the Fed's December stance and boosting demand for Bitcoin. Bitcoin ETFs have attracted nearly $1.4 billion in the last two trading days, reflecting the strong interest in the crypto market.
Trump Administration's Crypto Push Could Shift the Landscape
Adding to the bullish sentiment, reports surfaced today that U.S. President Donald Trump’s administration is preparing to issue an executive order prioritizing cryptocurrencies.
This move is expected to offer a platform for the industry to voice concerns and work with key stakeholders to shape more favorable regulations.
The announcement has sparked speculation that the U.S. could even establish a reserve with its BTC holdings.
For the crypto sector, these developments are seen as a shift toward more constructive regulations compared to the stricter policies under the Biden administration.
Bitcoin’s performance over the last three months has been impressive, gaining 60% in value since November. This rally coincided with the U.S. elections, but December saw a pause as market participants assessed the Fed’s next steps.
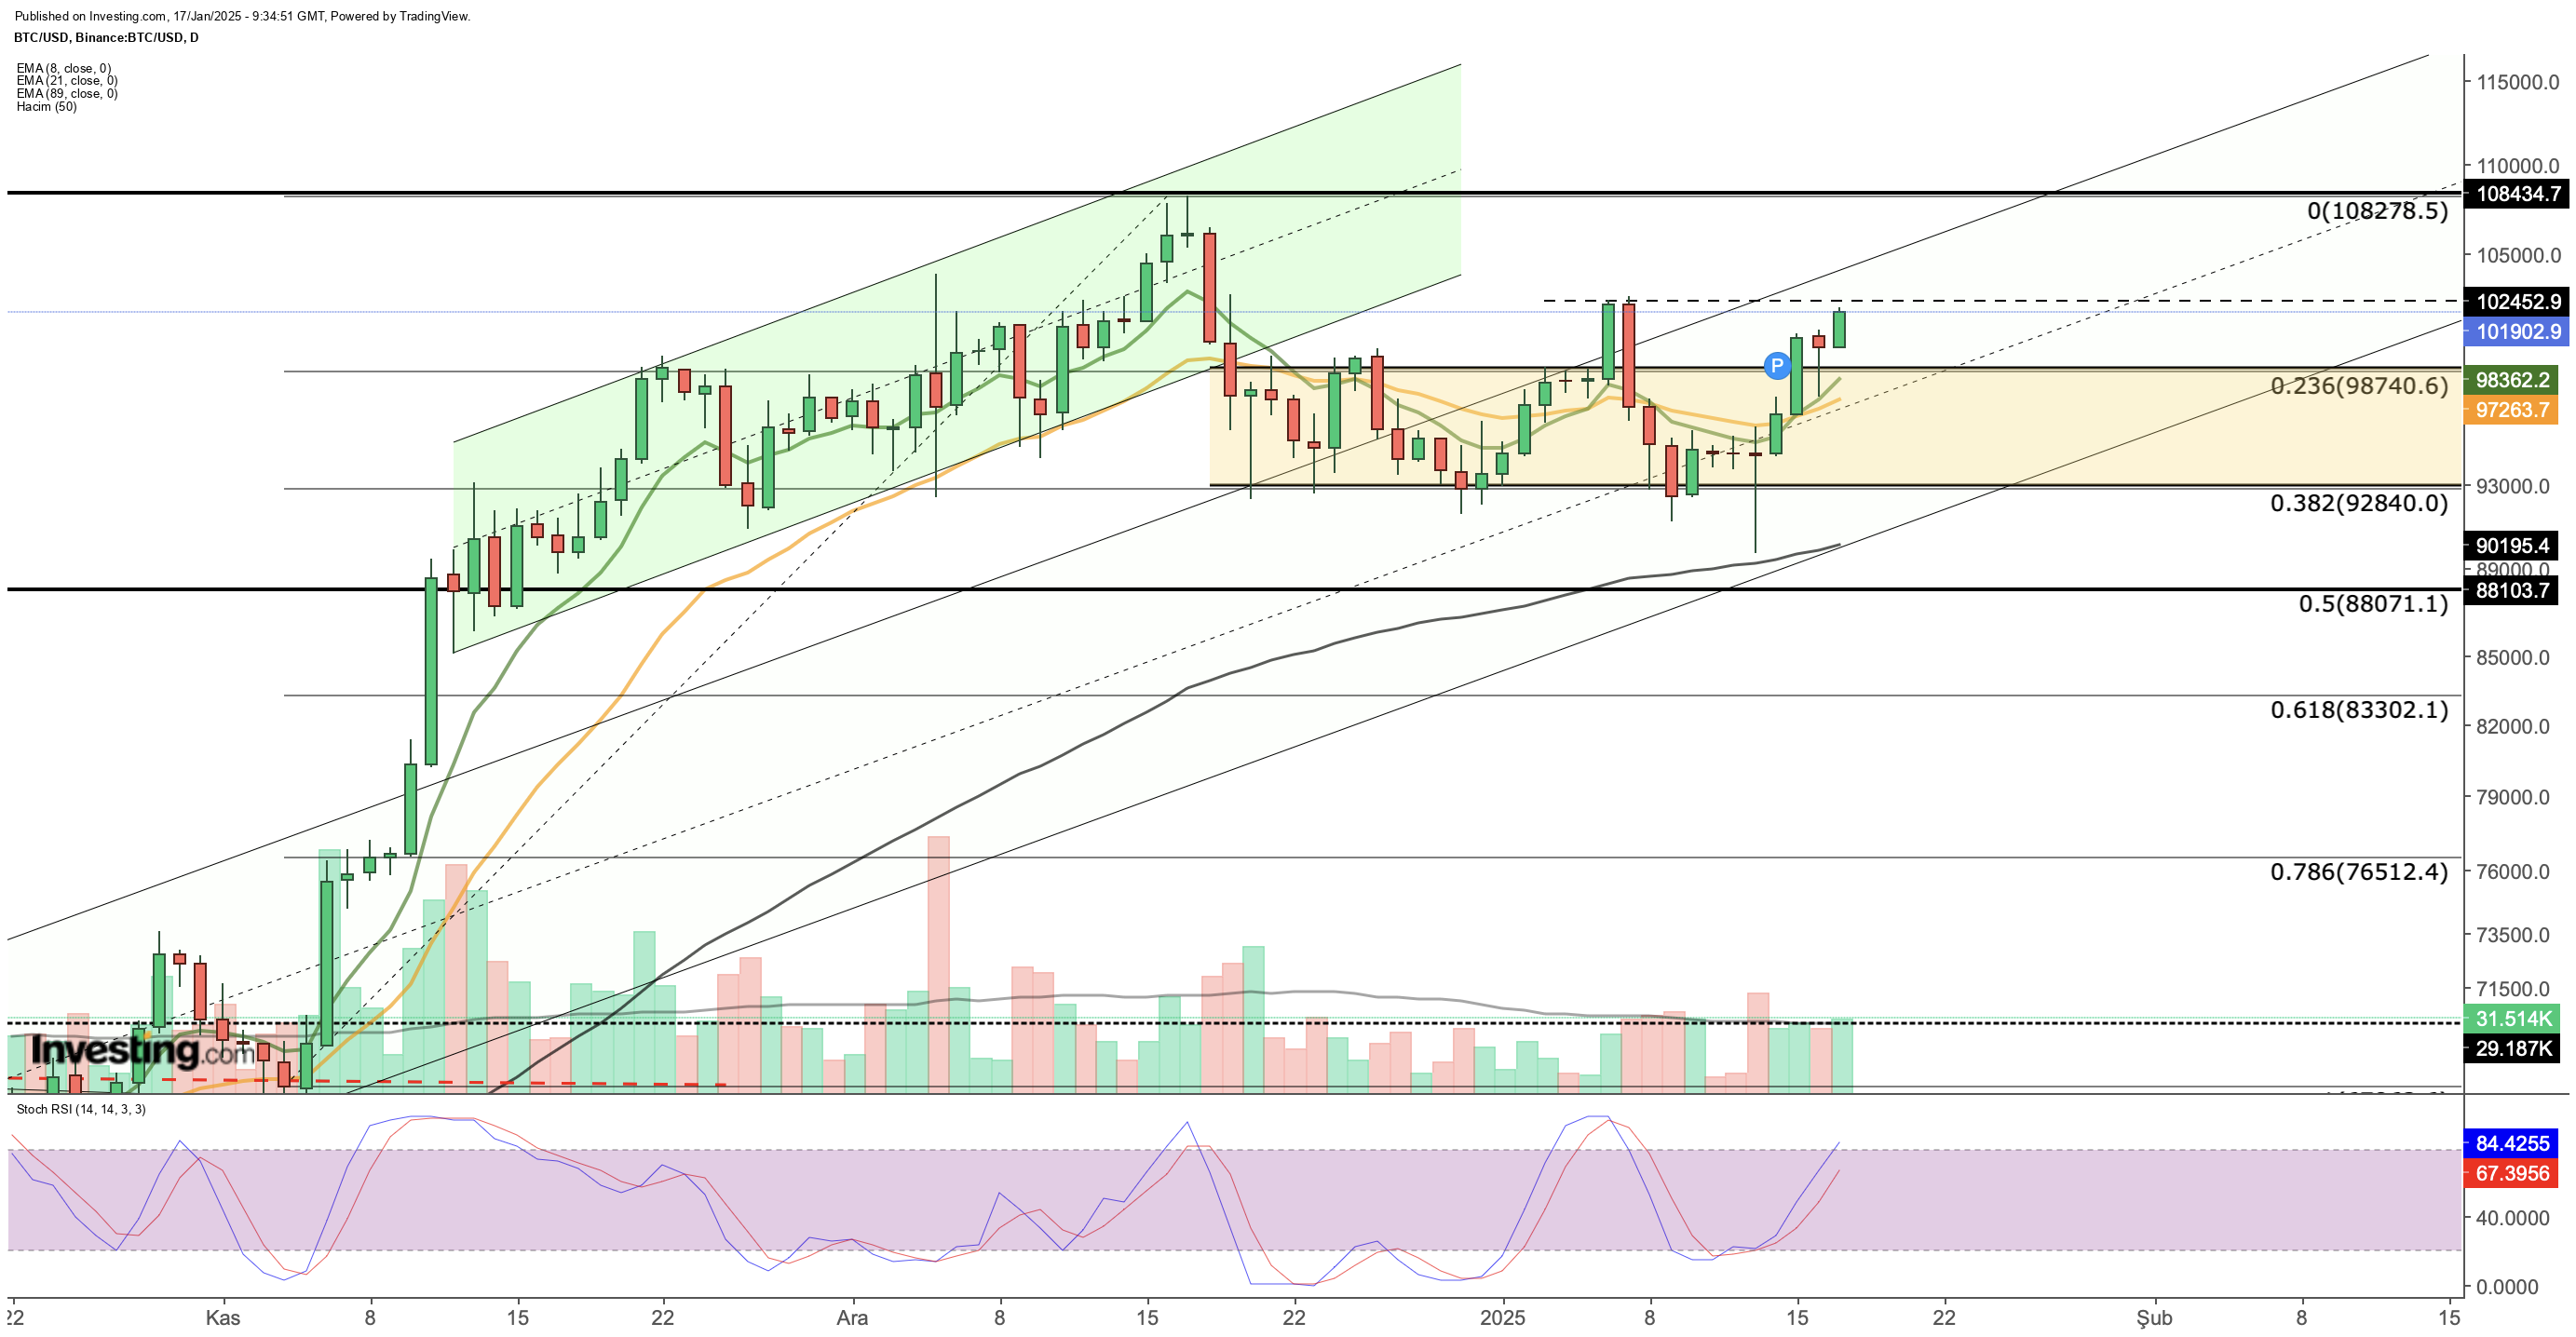
Despite this, Bitcoin held strong support at around $92,000. Now, ahead of Trump’s inauguration next week, Bitcoin is back above the $102,000 mark, pushing against early January’s resistance levels.
With macroeconomic data aligning in its favor, Bitcoin has regained momentum and moved above the $100,000 threshold.
Bitcoin: Key Technical Levels to Watch
Bitcoin briefly dipped below $90,000 at the start of the week but quickly reversed, climbing back into its consolidation zone. The market responded positively to inflation data, breaking through the $98,740 resistance and pushing toward $100,000.

Today, Bitcoin is testing the intermediate resistance at $102,450, with technical indicators signaling a continued upward trend.
The Stochastic RSI shows a bullish signal and short-term EMAs have crossed positively. If Bitcoin can clear $102,450, a move toward $103,000 is possible, potentially setting the stage for a test of the recent peak at $108,000.
However, if Bitcoin fails to break through this resistance, it may retrace to the $98,700 support level. A bounce here could maintain the current uptrend, but any failure to hold this support would likely bring Bitcoin back into its consolidation range around $92,000.
Mid-Term Outlook: Will the Rally Continue?
As Bitcoin trades near critical levels, the coming days will reveal more details about the U.S. executive orders on crypto.

A dovish Fed stance could support further price gains, though inflationary pressures under the Trump administration might prompt a more cautious approach from the central bank. In this scenario, traders could take profits after a potential rally.
A Bigger Picture: Rally Could Target (NYSE:TGT) $108,000
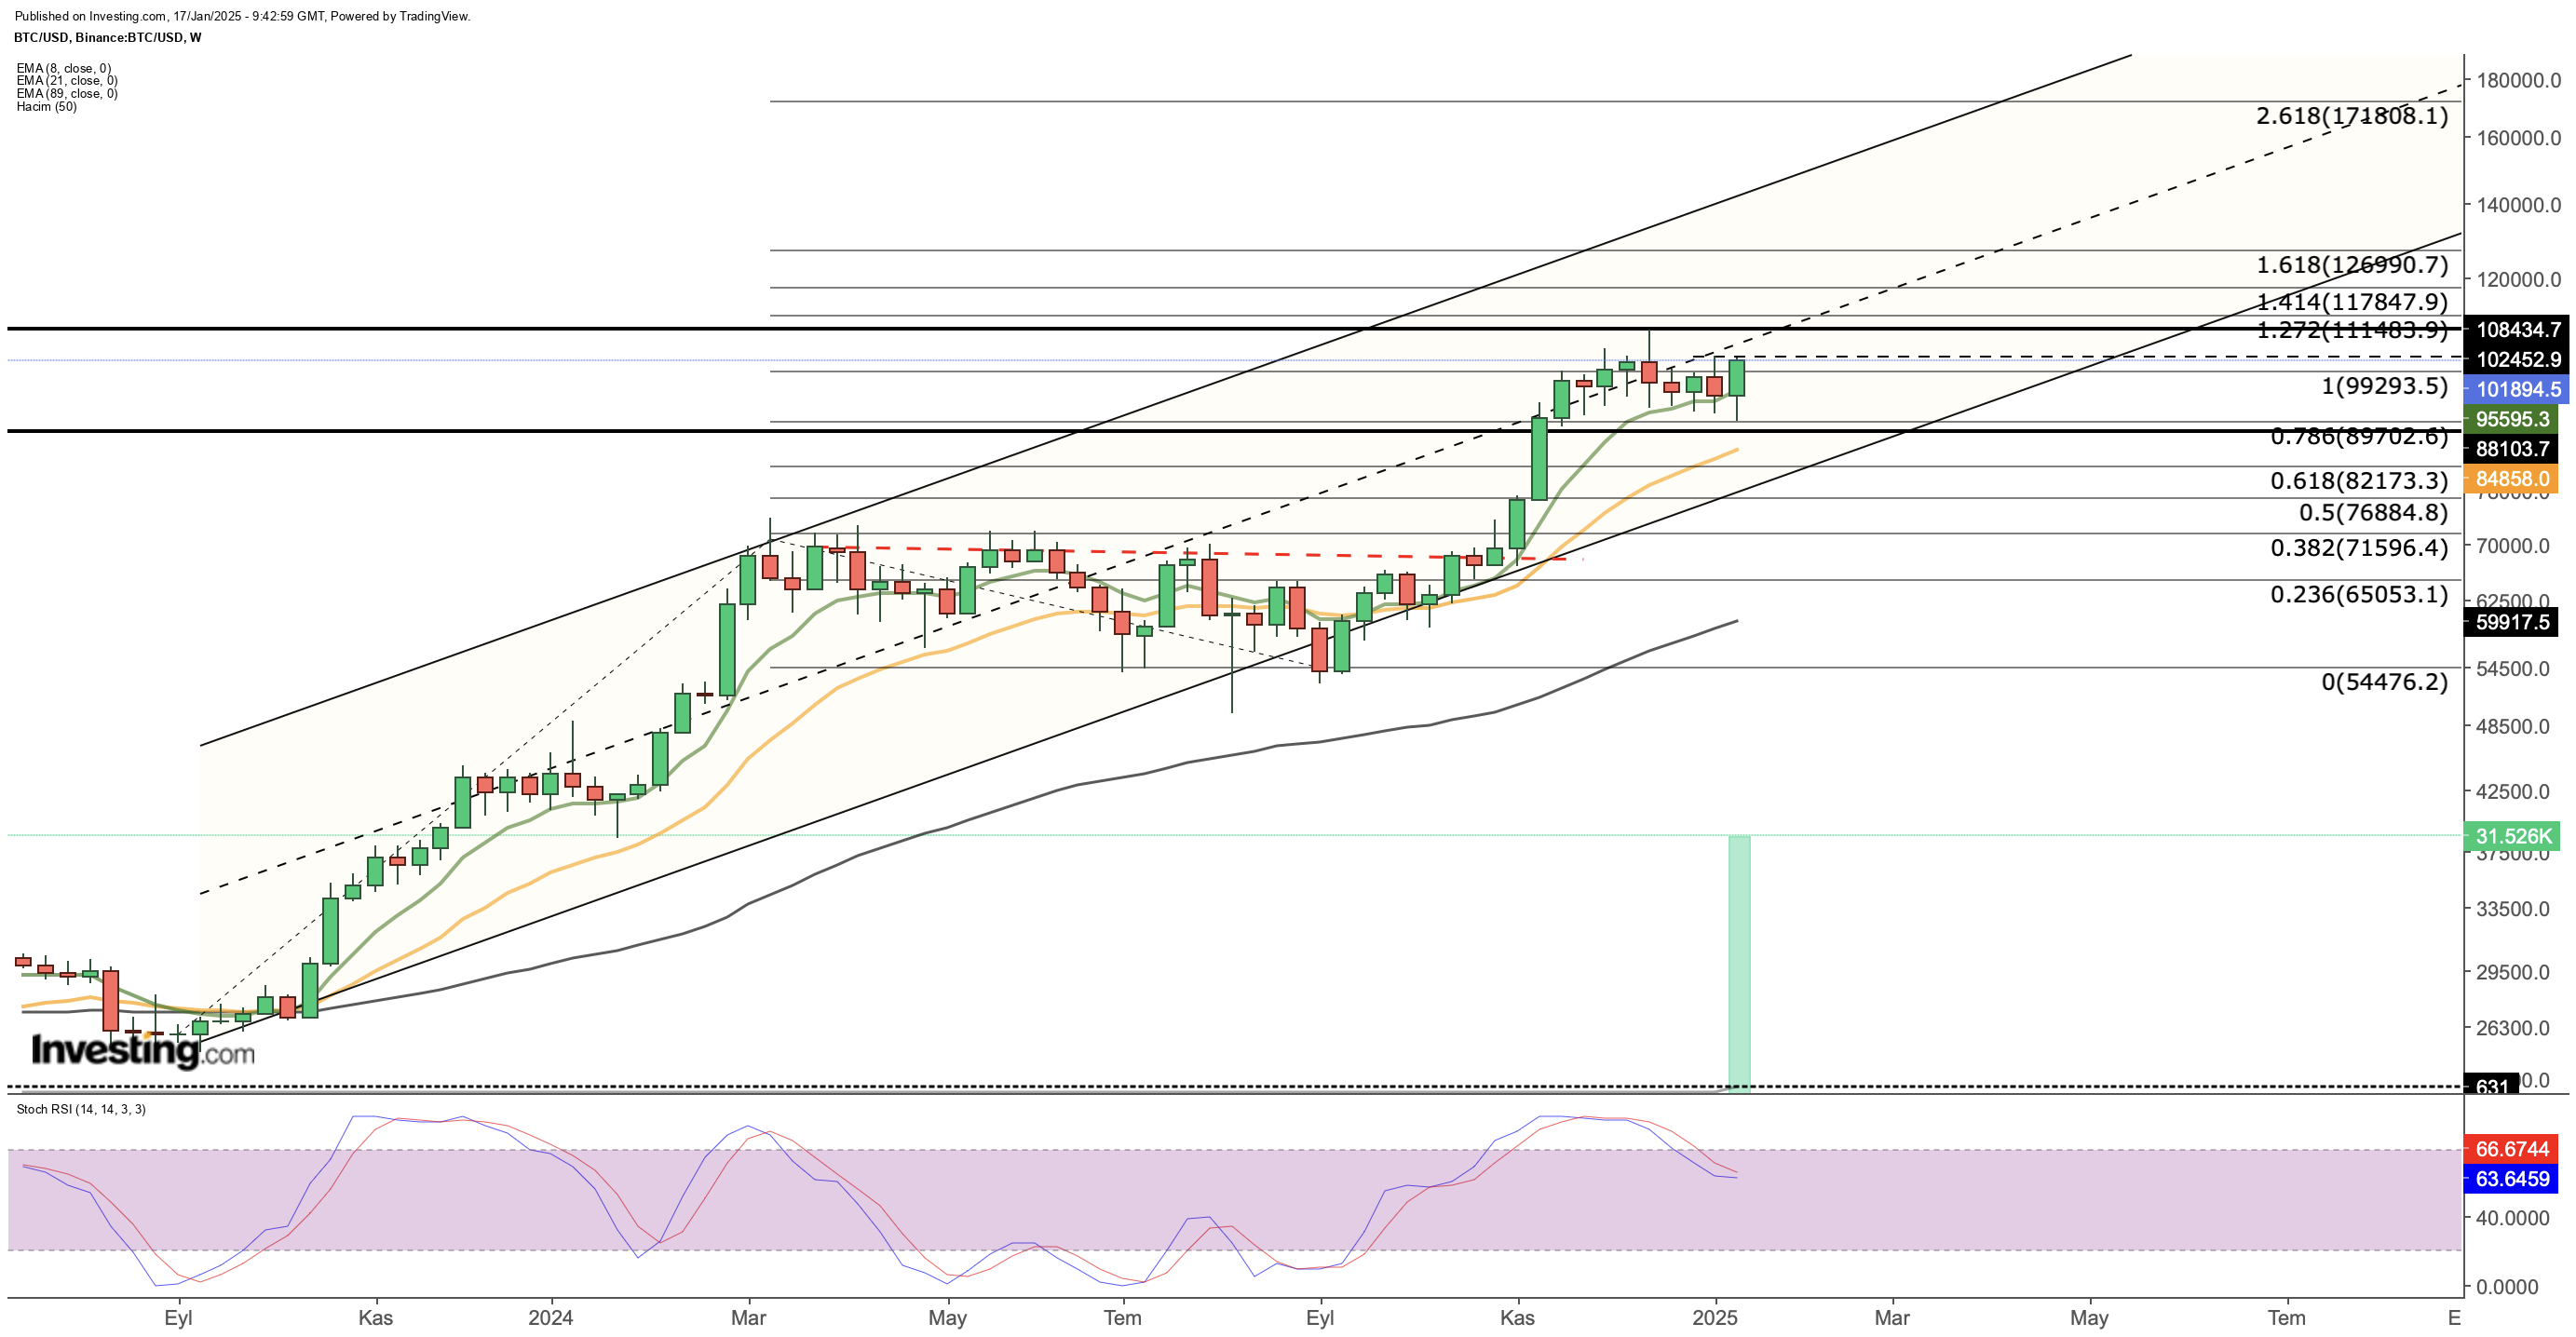
When viewed on the weekly chart, Bitcoin remains in a rising channel, with $108,000 standing as a significant resistance level. If Bitcoin can break above this threshold, the next targets may be $111,400, $117,800, and even $127,000.
With positive sentiment across the macroeconomic landscape and key policy shifts on the horizon, Bitcoin traders will want to keep a close eye on these levels for clues about the next big move.
***
Curious how the world’s top investors are positioning their portfolios for the year ahead?
You can find that out using InvestingPro.
Don’t miss out on the New Year's offer—your final chance to secure InvestingPro at a 50% discount.
Disclaimer: This article is written for informational purposes only. It is not intended to encourage the purchase of assets in any way, nor does it constitute a solicitation, offer, recommendation or suggestion to invest. I would like to remind you that all assets are evaluated from multiple perspectives and are highly risky, so any investment decision and the associated risk belongs to the investor. We also do not provide any investment advisory services.

