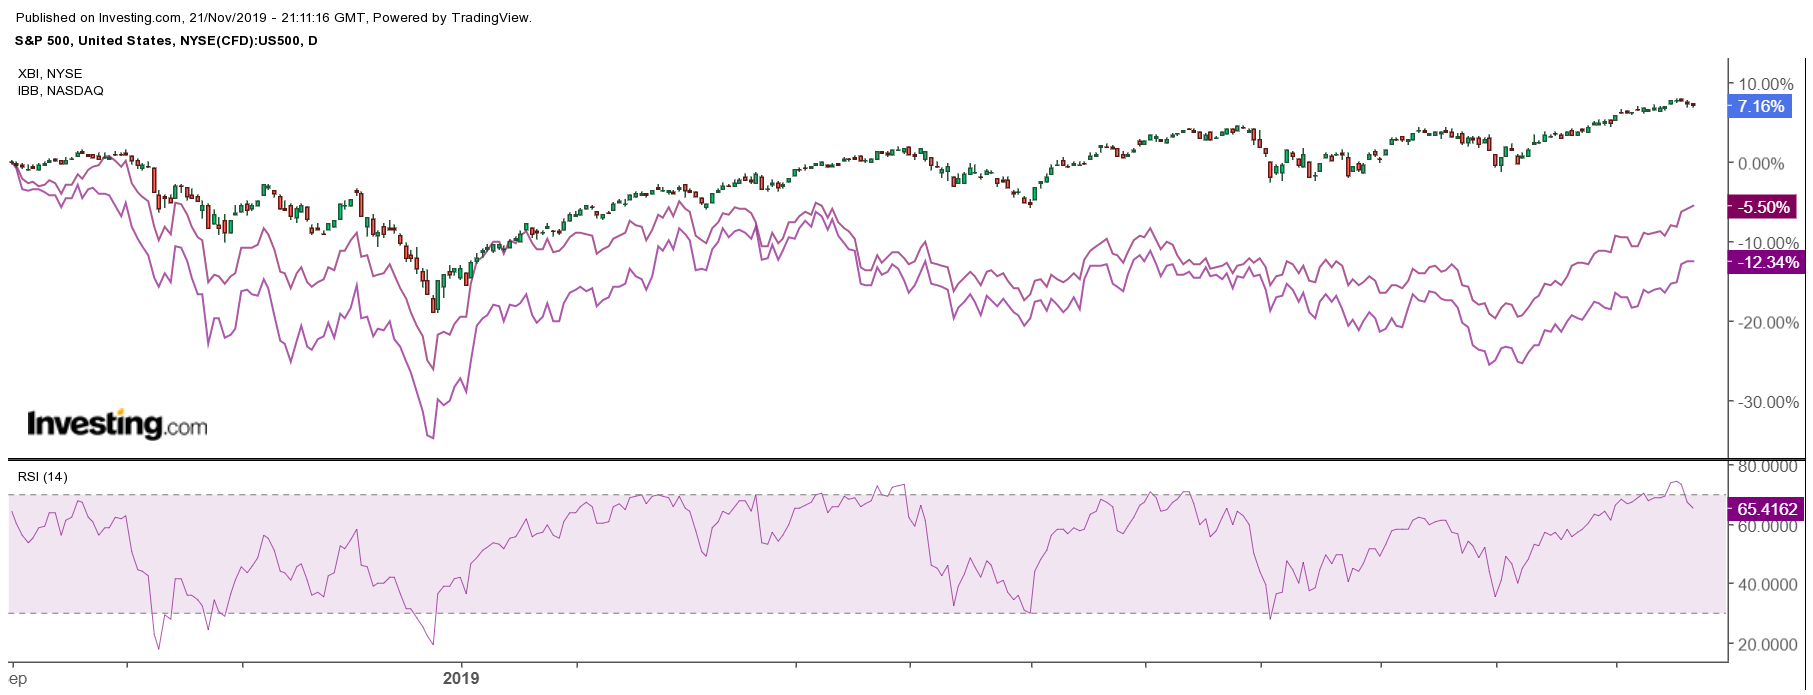
The biotech sector, as measured by the SPDR S&P Biotech (NYSE:XBI) is staging what could be a massive break out. The ETF has been trending lower since September 2018, with shares of the ETF declining by over 12%, versus an S&P 500 that has increased by over 7%. Now the biotech ETF may be on the cusp of a big come back and may be about to surge by as much as 8%.
That’s not all, the iShares Nasdaq Biotechnology (NASDAQ:IBB), the IBB, is also challenging a breakout of its own, confirming the move higher in the XBI ETF. Like, the XBI, the IBB has fallen by more than 6% over the same period. If the IBB ETF should breakout, it could go on to rise by as much as 6% from its current levels. A surging biotech sector may also help to paint a bullish narrative for the entire equity market, as investors seek to take on more risk.

XBI Biotech ETF Is Breaking Out
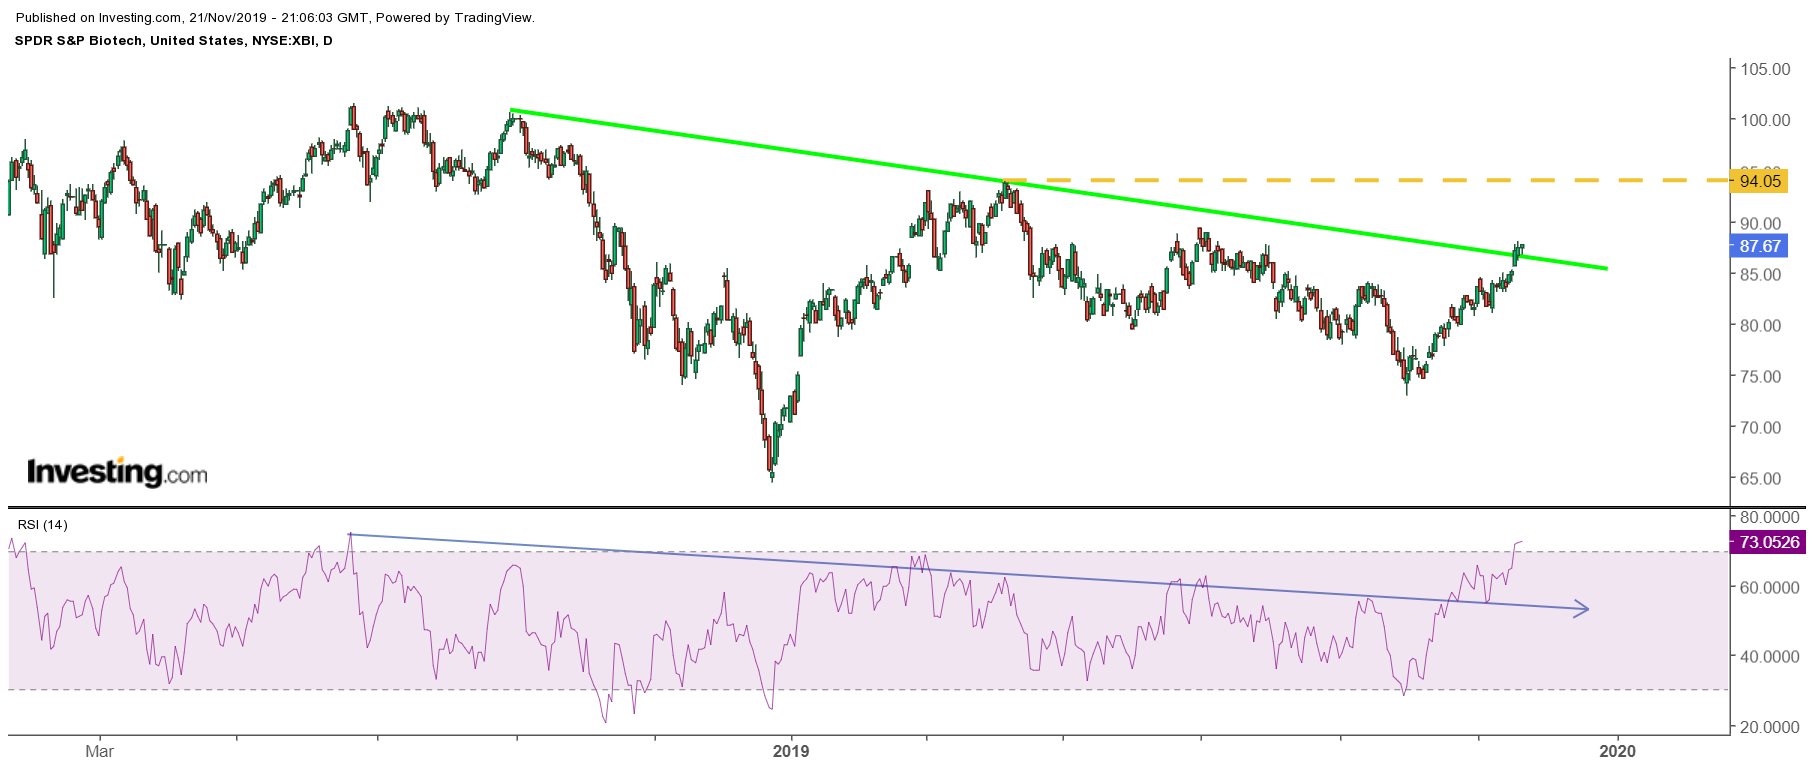
The XBI ETF has been trending lower since peaking in early September 2018. But now the ETF is challenging that downtrend and a level of technical resistance at $87.25. Should the ETF manage to rise above this downtrend and the resistance level, it could go on to increase to around $94, a gain of about 7.5% from its current price of roughly $87.50.
Additionally, the relative strength index for the XBI is showing that at the same time, momentum in the ETF may be shifting. The RSI had been trending lower starting in June 2018. But now that trend has been broken, and that may be suggesting that bullish momentum is now entering the ETF.

IBB ETF Is Confirming the XBI’s Move Higher
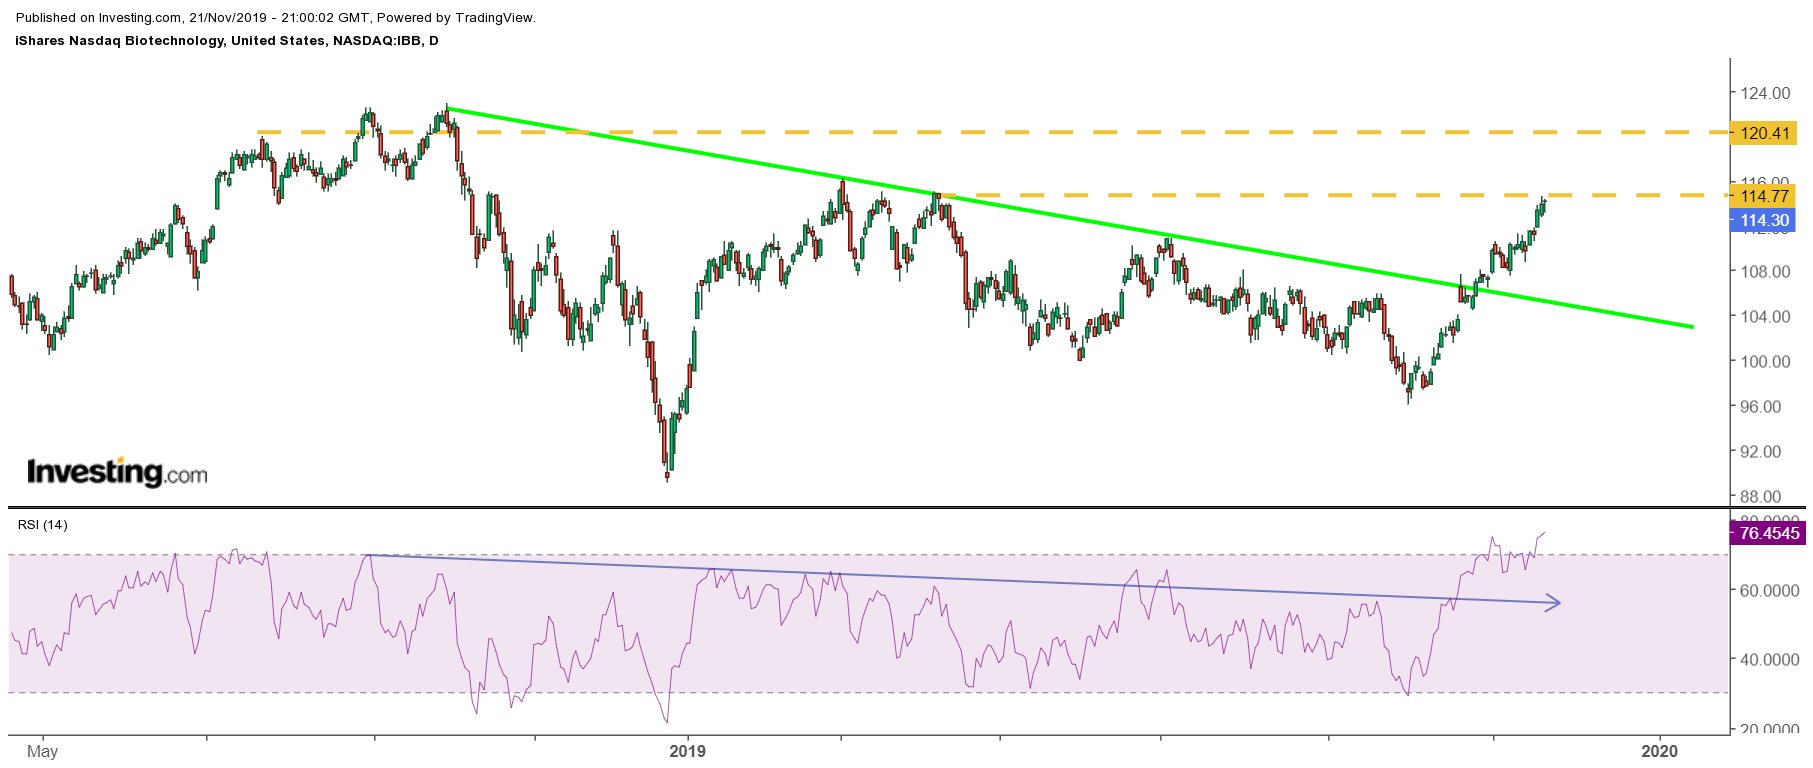
The IBB is also showing it is strengthening and that a change in trend is also occurring. The IBB ETF is now at a level of technical resistance at $114. Should the IBB rise above $114 it could go on to climb to its highest prices since September 2018 at $121. That would amount to a gain of about 6% from its current price of $114.25.
Also, like the XBI, the RSI of the IBB is also showing signs of an ETF that seeing a change in trend. The RSI for the IBB had been trending lower since September 2018 and has also recently broken above that downtrend. It, too, would suggest that the momentum in the IBB ETF may be turning more bullish.

Risk on Returning?
The bullish trends being witnessed by these two ETF’s could suggest and underscore that investors in the marketplace are actively looking to move into risky assets. The period of extreme volatility in the stock market starting in September 2018, based on the performance of these two ETF’s, appears to have pushed investors into less risky parts of the market. However, a move back into these risk assets, such as the biotech group, could be suggesting that investors are gaining more confidence in the stock market’s recent advance, allowing investors to feel more comfortable to take on these riskier assets.
If the biotech sector can continue to climb and push higher, breaking a more than year-long move lower, it could suggest that the broader market has further to rise as well.
