I am a risk manager, both literally and figuratively. Literally, since whether it is with our own funds and strategies or allocations for individual investor clients, or with my trading book back when I worked on Wall Street, the hard constraints are always capital, capital, and capital and so managing risk is part of how you make sure you don’t lose that capital.
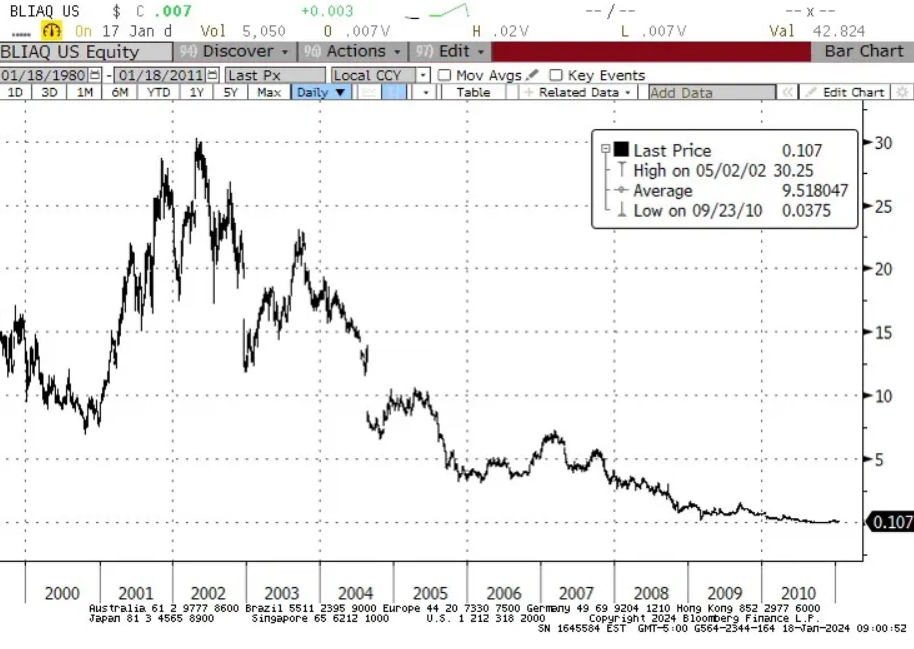
But also figuratively – my natural disposition is conservative, which is why I am a bond guy (concerned with getting my original investment back at par, at the end) rather than an equity guy (filled with dreams of a 10-bagger because I’m the first guy to figure out that Blockbuster Video is going to revolutionize video rental, and not so worried about how it will vanish almost overnight to Netflix).
So when I look at the investing landscape, I’m generally not focusing very much on ‘what I think is going to happen’; rather I spend more time thinking about the range of possible things that might happen, and their relative likelihoods.
In theory, all rational investors do this but the markets do not trade like it. For example, currently Crude Oil trading at $72.60 does not seem to put any weight on the possibility of a hot war in the Middle East that could abruptly spike prices to $125/bbl or more.
That’s not a prediction there will be a conflict that disrupts oil production or distribution (which, since there’s already a conflict – even though it hasn’t impacted oil production and only marginally impacted distribution – doesn’t seem like the sort of tiny-risk possibility we can ignore), but merely an observation. If you think there’s even a 10% chance that oil spikes $50/bbl, it would be worth $5/bbl.
“But Mike,” you say, “maybe that’s already in the price and but for that possibility oil would be $5 lower?”
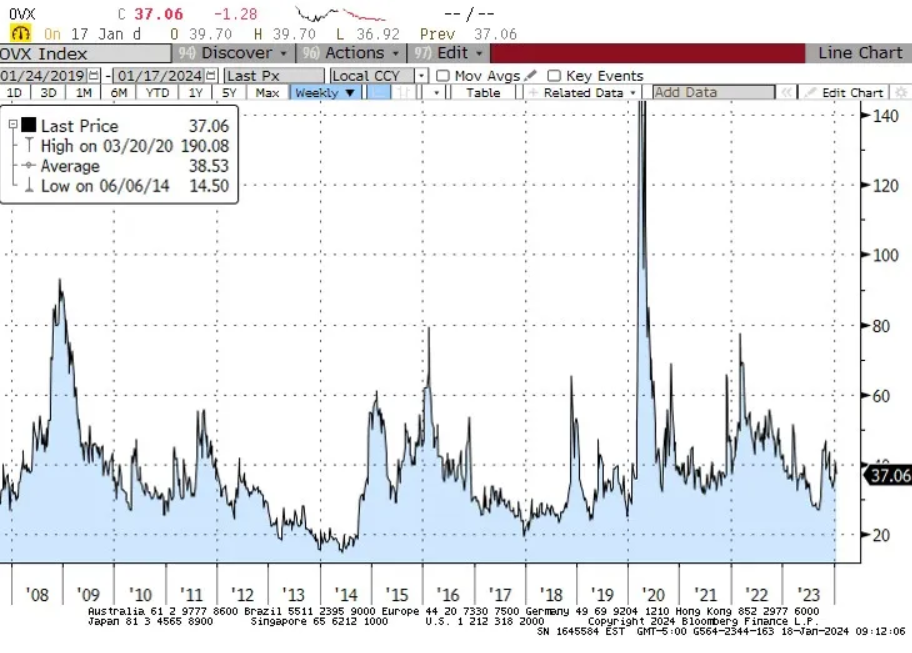
Well, the risk manager in me looks for confirmation that the market is at least a little nervous, and with the Oil VIX trading at its long-term average and well below the average of the post-2020 spike it strikes me as hard to characterize the energy markets as ‘nervous.’
Anyway, this is why I dislike year-end ‘outlook’ pieces and why when I forecast CPI for a year or two out I almost always focus on a range of probable outcomes rather than a point estimate.
Honestly, we should all do this, but not enough people have studied enough statistics to understand the significance of the error bars. If you have an experimental mean and a nice large error bar, it signifies that you can’t reject the possibility that the true mean is anywhere in the range covered by the error bar.
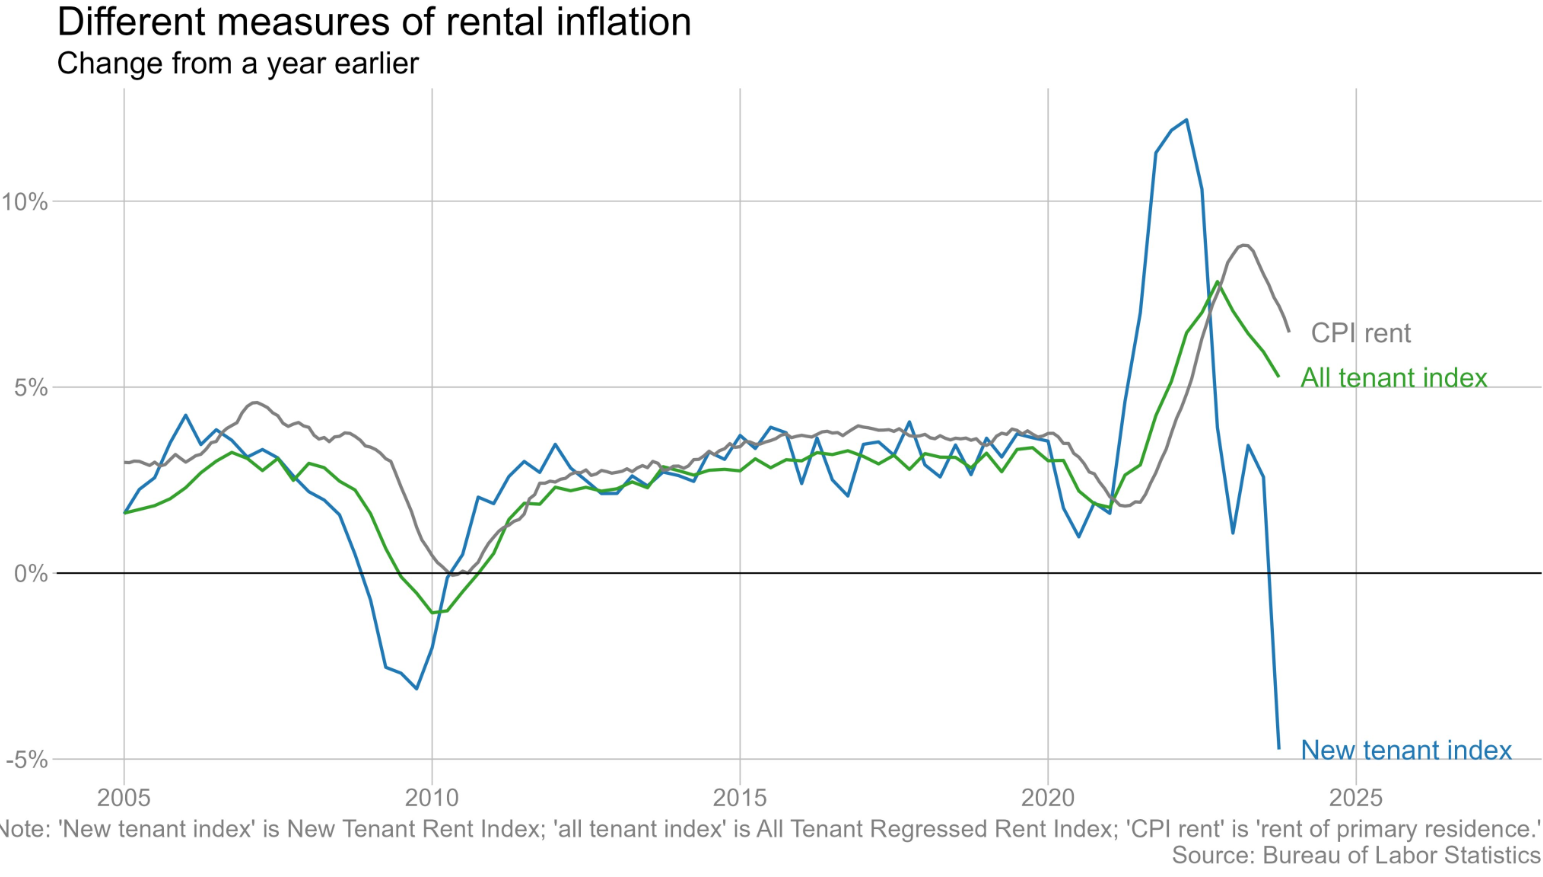
That’s why, when someone introduces a new rent index that supposedly is more current but by their own admission has 15 times the standard error, I ignore it.
Enough of the preliminaries. Let me get on with this. Here are my thoughts about the balance of risks for just a few important items:
1. Interest Rates
The balance of risks is clearly higher.
This was even more true at the end of the year. But with 10-year rates at 4.11%, down from 5% in October, keep in mind that two ways to get lower interest rates are already priced in: the short end of the curve reflects expectations (despite Fed officials’ protestations to the contrary) of roughly 150bps of cuts in the overnight policy rate this year, and the long end reflects inflation expectations of only 2.27% inflation over the next 5 years and only 2.30% inflation over the next decade.
On top of this, consider that with the trade deficit declining but the budget deficit not declining, more of the budget deficit will have to be funded from domestic saving – and the Fed is still shrinking its balance sheet, so it is pushing in the opposite direction. The balance of risks in the bond market is to higher rates.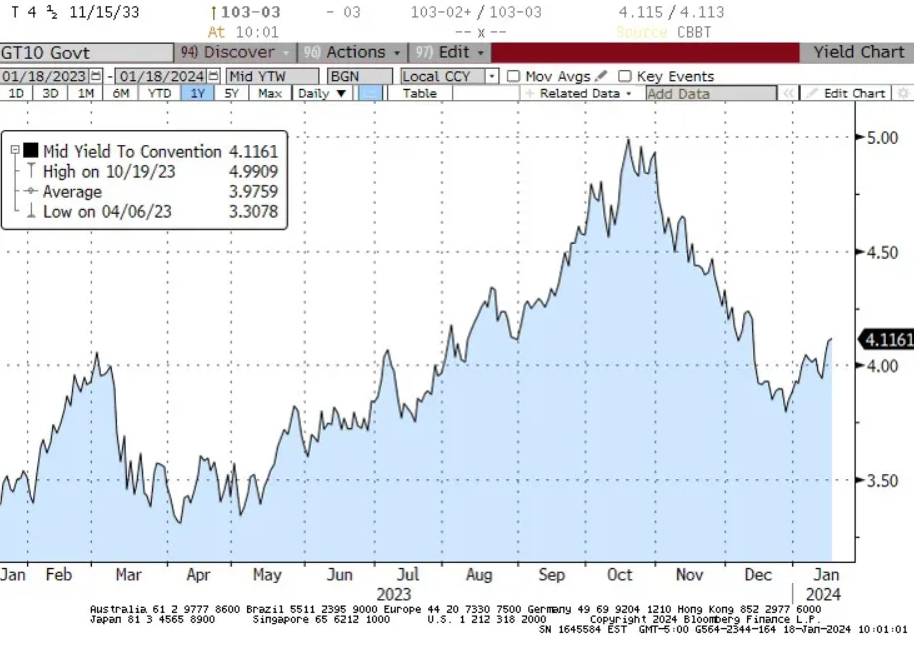
2. Stock Market
Balance of risks is lower, with the caveat that the picture is much better if looking at the market ex-the ‘Magnificent 7’ hot stocks (Apple (NASDAQ:AAPL), Nvidia (NASDAQ:NVDA), Meta (NASDAQ:META), Tesla (NASDAQ:TSLA), Amazon (NASDAQ:AMZN), Microsoft (NASDAQ:MSFT), and Google (NASDAQ:GOOGL)).
The S&P currently has a P/E of 21.4 and is up 24% since the end of 2022. The S&P ex-Mag7 has a P/E of 18.4 and is up 11% since the end of 2022. The Magnificent 7 themselves have a P/E of 39.5 and are up 110% over the last year.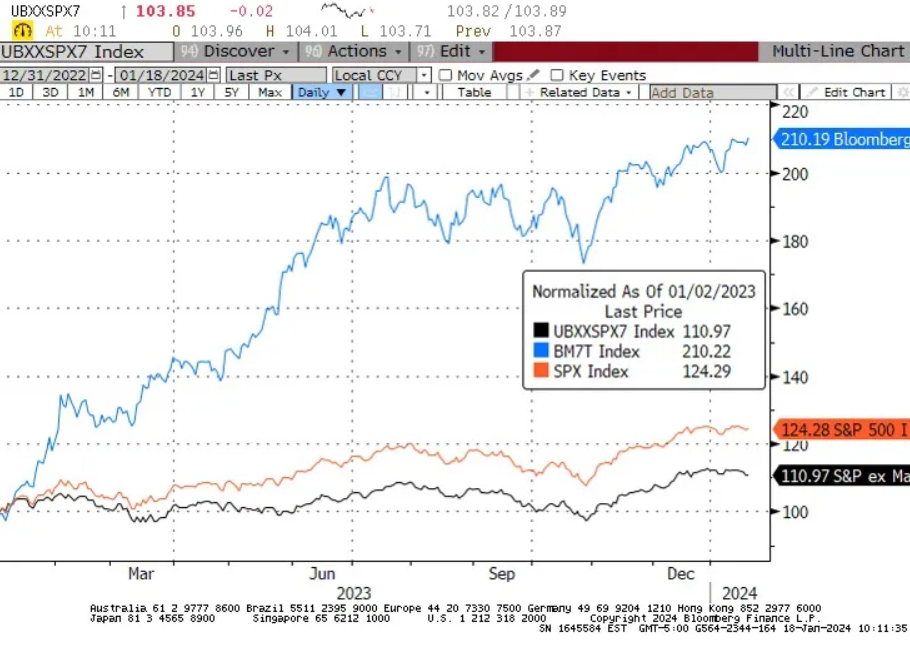
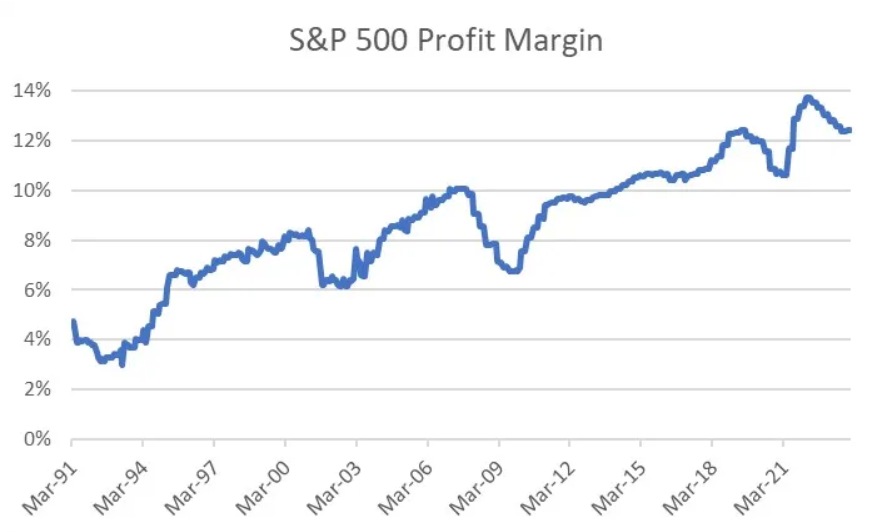
The overall market P/E looks not too bad until you remember that this is only because profit margins are currently only just a bit below at least 30-year highs (and probably lots longer – this is as far back as Bloomberg has trailing 12-months margins).
The balance of risks is definitely for lower margins, which means lower earnings, which means the same equity prices would represent higher P/Es. Oh, and whatever happened to those people saying that the high equity prices were due to the really low-interest rates? Haven’t heard from them in a while.
Where I have clients who are long equities, they’re long equal-weight indices so as to lessen exposure to the Magnificent 7. But even if those stocks were the only ones overvalued, it’s not reasonable to think that they can come back to earth and not bring down the rest of the market.
If Apple, Nvidia, Meta, and Microsoft drop 30%, the rest of the market isn’t going to go up. However, if such a thing were to happen the market outside of the Mag 7 could feasibly eventually get to looking cheap.
3. Credit Spreads
Balance of risks is wider, with the 10-year Baa credit spread near 30-year lows. Really, how low does this go? And the tails are obviously one-way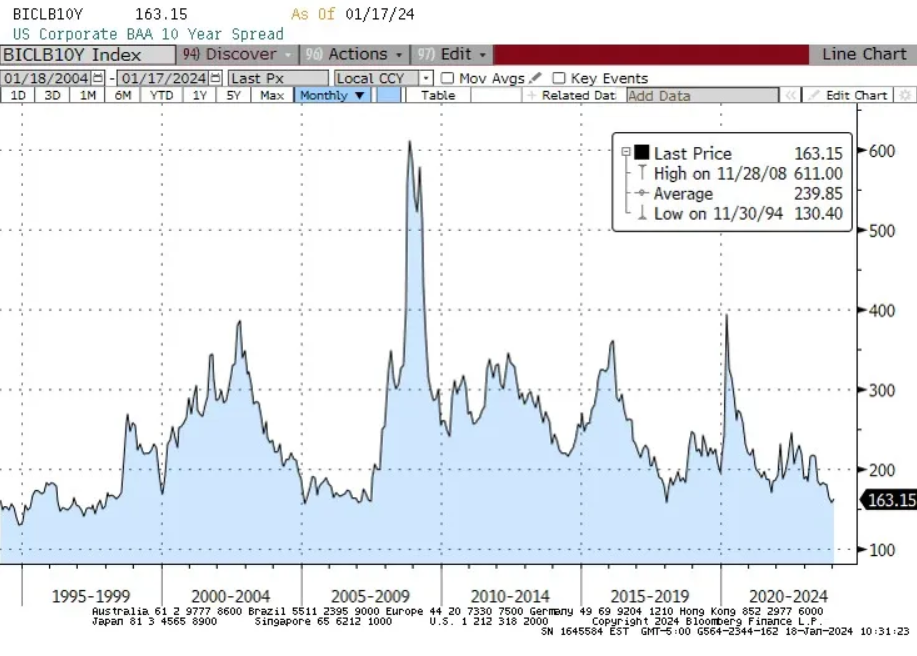
So I’ve said the balance of risks favor higher interest rates, wider credit spreads, lower corporate margins, and lower equity prices. It’s also useful to think about where the risks are in my risk assessments. If we get lower interest rates, instead of higher, then it’s very likely due to the economy being a lot weaker than it currently is, and the Fed ends up having to ease more than 150bps in 2024.
That seems unlikely to me, but if it happens then notice that probably also means that credit spreads will widen and corporate margins, earnings, and stock prices decline. So, if you’re bullish on bonds and stocks, it seems to me you’re taking a dangerously narrow path. The balance of risks to me look bearish on both sides of that, but the bullish outcome for bonds implies (I think) a bearish outcome for stocks. It’s difficult for me to see an environment with appreciably higher stocks and bonds, unless the Fed eases aggressively without any economic weakness. So that’s your implied bet.
On the other hand, being bearish both stocks and bonds doesn’t carry such a narrow path risk. Unless the Fed eases despite a solid economy, It isn’t hard to envision an environment with lower stocks and bonds. Heck, we had just such an environment a few months ago, pre-‘pivot.’ It’s not a reach.
Bottom Line
None of the preceding is a forecast. But investing and trading are about evaluating the range of risks, and trying to take positions with asymmetric risk-adjusted payoffs. In my opinion, long-only investors should be playing short on the yield curve (and going up credit, and inflation-linked rather than nominal) and anti- cap-weighting their stock holdings.
That’s as close to an outlook piece as I am doing this year. Have fun.
Which stock should you buy in your very next trade?
With valuations skyrocketing in 2024, many investors are uneasy putting more money into stocks. Unsure where to invest next? Get access to our proven portfolios and discover high-potential opportunities.
In 2024 alone, ProPicks AI identified 2 stocks that surged over 150%, 4 additional stocks that leaped over 30%, and 3 more that climbed over 25%. That's an impressive track record.
With portfolios tailored for Dow stocks, S&P stocks, Tech stocks, and Mid Cap stocks, you can explore various wealth-building strategies.
