Coin Edition -
- XRP’s price has risen 2.86% over the last 24 hours.
- The remittance token’s price is trading within a consolidation channel.
- Technical indicators suggest that XRP’s price may drop in the coming 24-48 hours.
Ripple is a technology that acts as both a cryptocurrency and a digital payment network for financial transactions. It was first released in 2012 and was co-founded by Chris Larsen and Jed McCaleb.
Ripple’s main process is a payment settlement asset exchange and remittance system, similar to the SWIFT system for international money and security transfers, which is used by banks and financial middlemen dealing across currencies.
The token used for the cryptocurrency is premined and utilizes the ticker symbol XRP. Ripple is the name of the company and the network, and XRP is the cryptocurrency token. The purpose of XRP is to serve as an intermediate mechanism of exchange between two currencies or networks – as a sort of temporary settlement layer.
XRP Current Market Standing
XRP (XRP) is ranked as the 6th biggest crypto by market cap, according to CoinMarketCap, and experienced a 24-hour rise in the price of 2.86% to take its price up to $0.4125. This also puts its total market cap at approximately $20.957 billion at press time.
Despite the positive 24-hour performance, the weekly performance for the remittance token is still in the red at -0.22%.
XRP Technical Overview

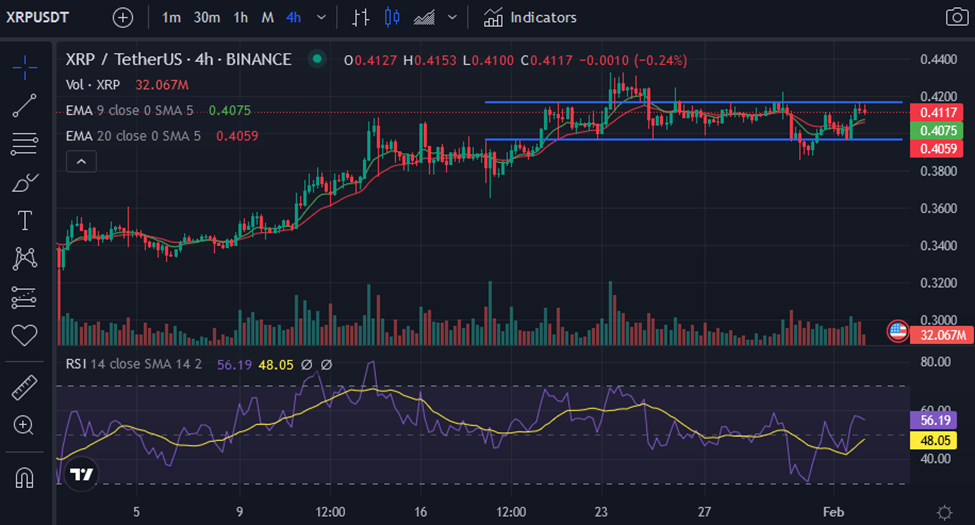
4-hour chart for XRP/USDT (Source: CoinMarketCap)
XRP’s price is trading in a consolidation price channel on its 4-hour chart. This channel is between $0.3967 and $0.4173. The altcoin’s price attempted to break bearishly out of the channel on the 30th of January, 2023, but bulls swooped in to push the price back into the consolidation channel.
The 9 EMA line has crossed the 20 EMA line on the 4-hour chart, which is a bullish sign. This bullishness is further supported by the bullishness expressed by the RSI indicator on the 4-hour chart, as the RSI line is positioned above the RSI SMA line.
Investors and traders may need to brace for a small price drop, however, as the RSI line is sloped negatively towards oversold territory – suggesting that XRP’s price has reached a local top.

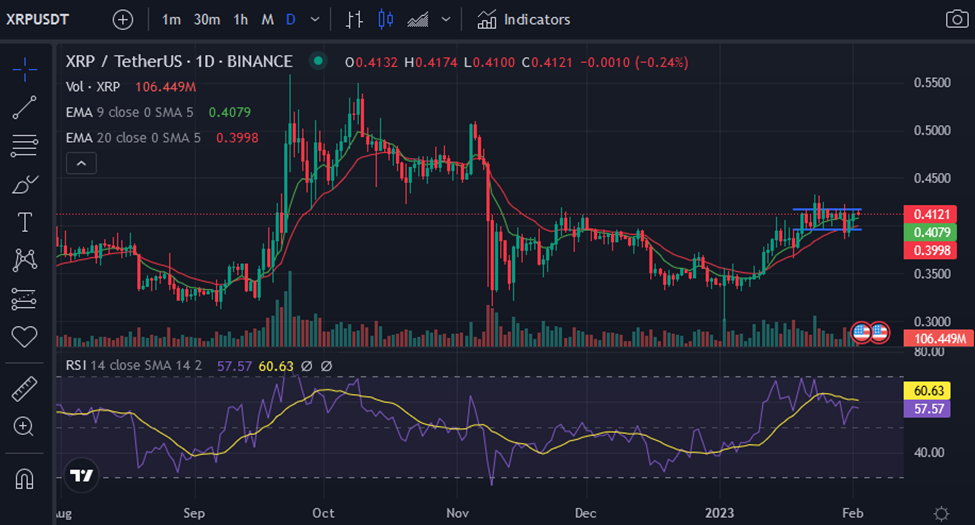
Daily chart for XRP/USDT (Source: CoinMarketCap)
Zooming out to the daily time frame for XRP/USDT also shows that the price of XRP is in a consolidation phase. The 9-day EMA line is positioned above the 20-day EMA line and the 9-day EMA continues to offer XRP’s price some support.
A bearish flag present on XRP’s daily chart is the daily RSI indicator. At press time, the daily RSI line is positioned below the daily RSI SMA line. In addition to this, the RSI line is bearishly sloped towards oversold territory, which is suggestive of a price drop for XRP in the next 24-48 hours.
Should XRP’s price drop in the next 2 days, then it will first drop to the immediate support at the 9-day EMA, which is around $0.4078, before dropping to the lower bound of the previously mentioned price channel at $0.3967.
The RSI indicators on both XRP’s 4-hour and daily charts suggest that XRP’s price has reached a local top and will likely fall in the coming 24-48 hours. Should a potential price drop occur, it will be a minor drop in price given that XRP’s price is trading in a sideways consolidation channel and is receiving support from the 9 EMA lines on both timeframes.
This bearish thesis will be invalidated, however, if XRP’s price is able to break and close above the daily resistance level at around $0.4349 in the next 24-48 hours. Should this happen, the market may FOMO which will subsequently result in the price of XRP targeting the next resistance level at $0.4739.
An event that traders may want to trade around is the ISM Non-Manufacturing PMI announcement that will take place on the 3rd of February. Should statistics come in better than expected then XRP’s price may receive some additional bullish support to ignite a mini rally to the resistance level at $0.4349.
Disclaimer: The views and opinions, as well as all the information shared in this price prediction, are published in good faith. Readers must do their research and due diligence. Any action taken by the reader is strictly at their own risk. Coin Edition and its affiliates will not be held liable for any direct or indirect damage or loss.
The post XRP Price Prediction: What to Expect in the Next 48 Hours appeared first on Coin Edition.
