Breaking News
Investing Pro 0
👀 Bezos, Buffett & Berkowitz: What's in Their Portfolios? Unlock Data

Oil slips despite bullish U.S. stockpile balance, Russian cut

Published Mar 30, 2023 03:30
Saved. See Saved Items.
This article has already been saved in your Saved Items
 
© Reuters.
 
LCO
-1.47%
Add to/Remove from a Portfolio
Add to Watchlist
Add Position

Position added successfully to:

Please name your holdings portfolio
 
CL
-1.65%
Add to/Remove from a Portfolio
Add to Watchlist
Add Position

Position added successfully to:

Please name your holdings portfolio
 
NYF
-0.86%
Add to/Remove from a Portfolio
Add to Watchlist
Add Position

Position added successfully to:

Please name your holdings portfolio
 
GPR
-0.50%
Add to/Remove from a Portfolio
Add to Watchlist
Add Position

Position added successfully to:

Please name your holdings portfolio
 

By Barani Krishnan

Investing.com -- As the saying goes, “it is what it is”. 

Crude prices fell Wednesday despite a rash of bullish headlines on U.S. supply-demand and Russian production that suggested the market run-up of the past two days may have been excessive to some.

New York-traded West Texas Intermediate, or WTI, crude settled at $72.97 per barrel, down 23 cents, or 0.3%. The U.S. crude benchmark rose a total of nearly 6% between Monday and Tuesday.

London-traded Brent crude settled at $78.28, down 37 cents, or 0.5%, after a cumulative gain of almost 4% in two previous sessions.

Wednesday’s slide in oil came despite government data showing weekly inventories of U.S. crude falling the most in four months amid a drop in gasoline stockpiles as well that indicated a pick up in energy demand ahead of the oncoming summer driving season.

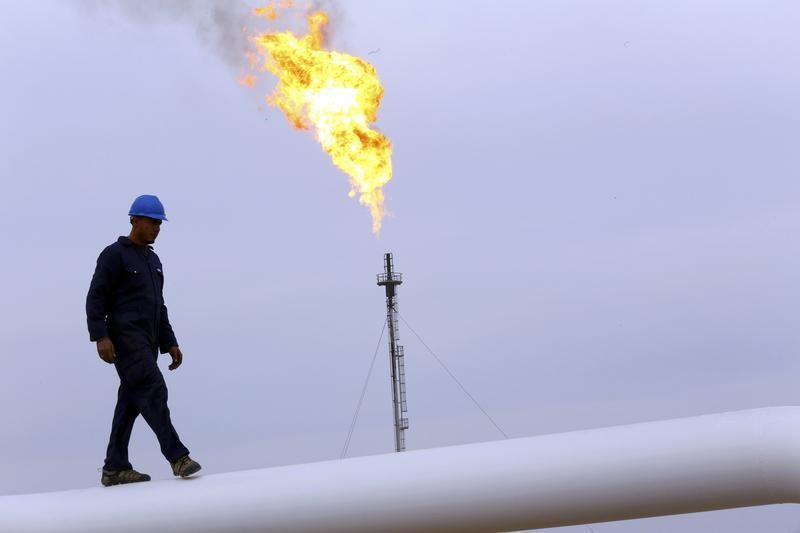
Headlines out of Moscow, meanwhile, said Russian crude production fell by 300,000 barrels per day in the first three weeks of March, to 9.78 million barrels per day. 

Russia’s “fire-sale” of its Urals crude — at $60 a barrel or lower, in compliance with Western sanctions related to the Ukraine war — has been cited as one of the reasons for the inability of the oil market to command a constantly high price for WTI and Brent. Major crude buyers such as India and China have sourced cheap supplies from Russia for months now and cut back on pricier supplies from other oil producers, that includes Saudi Arabia.

“The 300,000 bpd drop in Russian production falls short of the Kremlin’s previously announced plans to cut 500,000 barrels per day to help lift international prices,” said John Kilduff, partner at New York energy hedge fund Again Capital. 

“But the Russian news can still be regarded as moderately bullish because it involves a cut. The EIA news is certainly bullish, so you have to ask yourself why oil ended lower today. The answer probably is that some felt the market had gone up a little much at the start of the week and needed to consolidate. It is what it is.”

Crude stockpiles fell by 7.489 barrels during the week ended March 24, the Washington-based Energy Information Administration, or EIA, said in its Weekly Petroleum Status Report.

Historical data maintained by the EIA showed it to be the largest U.S. crude draw in a week since late November. The draw also marks a reversal from almost three straight months of crude builds since December that resulted in an additional supply of 60M barrels. 

Industry analysts tracked by Investing.com had forecast a build of 92,000 barrels instead for last week, versus the rise of 1.117M barrels seen during the previous week to March 17.

On the gasoline inventory front, the EIA reported a drawdown of 2.904M barrels against an expected drop of 1.617M barrels and the 6.4M-barrel decline in the previous week. Automotive fuel gasoline is the No. 1 U.S. fuel product.

With distillate stockpiles, there was a build of 281,000 barrels. Analysts had forecast a drop of 1.455M barrels versus the prior week’s deficit of 3.313M. Distillates, which are refined into heating oil, diesel for trucks, buses, trains and ships and fuel for jets, were originally the strongest demand component of the U.S. petroleum complex at the start of the year.

The summer driving season, which begins in earnest in late May and extends to late September at times, typically marks the heaviest demand period for motor fuels in the United States.

Oil slips despite bullish U.S. stockpile balance, Russian cut
 

Related Articles

Add a Comment

Comment Guidelines

We encourage you to use comments to engage with users, share your perspective and ask questions of authors and each other. However, in order to maintain the high level of discourse we’ve all come to value and expect, please keep the following criteria in mind: 

  • Enrich the conversation
  • Stay focused and on track. Only post material that’s relevant to the topic being discussed.
  • Be respectful. Even negative opinions can be framed positively and diplomatically.
  •  Use standard writing style. Include punctuation and upper and lower cases.
  • NOTE: Spam and/or promotional messages and links within a comment will be removed
  • Avoid profanity, slander or personal attacks directed at an author or another user.
  • Don’t Monopolize the Conversation. We appreciate passion and conviction, but we also believe strongly in giving everyone a chance to air their thoughts. Therefore, in addition to civil interaction, we expect commenters to offer their opinions succinctly and thoughtfully, but not so repeatedly that others are annoyed or offended. If we receive complaints about individuals who take over a thread or forum, we reserve the right to ban them from the site, without recourse.
  • Only English comments will be allowed.

Perpetrators of spam or abuse will be deleted from the site and prohibited from future registration at Investing.com’s discretion.

Write your thoughts here
 
Are you sure you want to delete this chart?
 
Post
Post also to:
 
Replace the attached chart with a new chart ?
1000
Your ability to comment is currently suspended due to negative user reports. Your status will be reviewed by our moderators.
Please wait a minute before you try to comment again.
Thanks for your comment. Please note that all comments are pending until approved by our moderators. It may therefore take some time before it appears on our website.
 
Are you sure you want to delete this chart?
 
Post
 
Replace the attached chart with a new chart ?
1000
Your ability to comment is currently suspended due to negative user reports. Your status will be reviewed by our moderators.
Please wait a minute before you try to comment again.
Add Chart to Comment
Confirm Block

Are you sure you want to block %USER_NAME%?

By doing so, you and %USER_NAME% will not be able to see any of each other's Investing.com's posts.

%USER_NAME% was successfully added to your Block List

Since you’ve just unblocked this person, you must wait 48 hours before renewing the block.

Report this comment

I feel that this comment is:

Comment flagged

Thank You!

Your report has been sent to our moderators for review
Continue with Google
or
Sign up with Email