Cyber Monday Deal: Up to 60% off InvestingProCLAIM SALE

Chart Of The Day: Is Disney's Supply-Demand Shift Signaling An Earnings Surprise?

Published 11/05/2019, 08:54 PM
Updated 09/02/2020, 02:05 PM
DIS
-

According to analysts, Walt Disney (NYSE:DIS) is almost certain to stay on trend with this quarter's mega cap earnings recession. The technicals, though, are indicating something curious for a stock that's widely slated to disappoint: the charts are suggesting that demand has overcome supply.

The entertainment giant's stock is expected to fall after its quarterly results are released on Thursday Nov. 7. Profits are seen plunging as much as 35% vs the same period a year ago, as the company's massive investment in 21st Century Fox and significantly increased spending on its new TV-streaming service, Disney+, continue to weigh on its performance.

But, if Disney’s stock is about to tank after the release, why has the its supply-demand balance flipped?
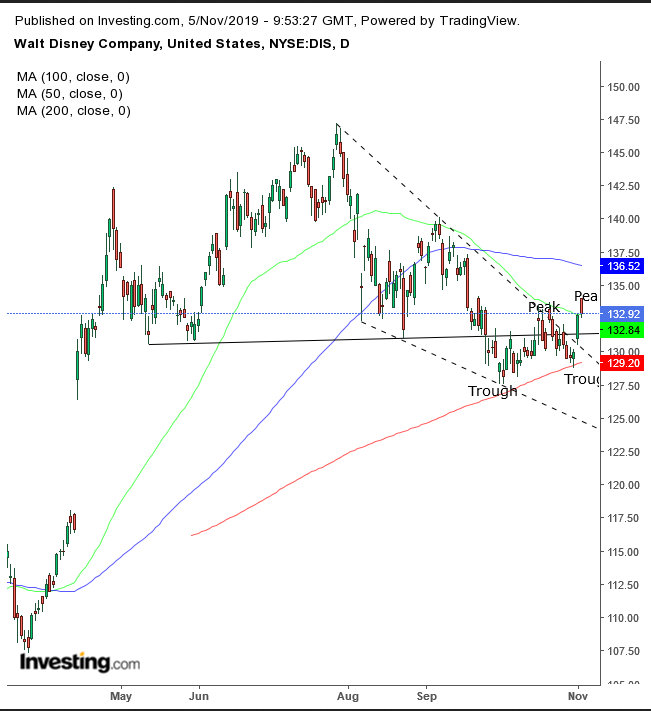
DIS Daily Chart

On Sept. 26, the stock completed a H&S top, when it fell below the neckline, the trendline that connects the pattern’s lows. However, the 200 DMA proved a worthy supporter, propelling the price back above the neckline, causing the pattern to blow out.

A pattern failure suggests that the price will be yanked in the opposite direction, like a coiled spring pulled the wrong way. The market mechanics include a short squeeze and traders scrambling to readjust positions in the new "right" direction.

We can see a few things happening at once: the aforementioned support of the 200 DMA bounced prices back above the H&S top neckline (which also escaped a falling wedge pattern, bullish after the preceding rise), a close above the 50 DMA and a new peak in a new short term uptrend.

Trading Strategies

Conservative traders should wait for a new peak above the July 29, $147.15 high, to ascertain the uptrend is intact.

Moderate traders may wait for the price to pull back and find support above the wedge and neckline, preferably with a close above the 100 DMA.

Aggressive traders may enter a long position now, after writing out a trading plan that fits their budget.

Trade Sample - Long Position

  • Entry: $132
  • Stop-Loss: $130
  • Risk: $2
  • Target: $138
  • Reward: $6
  • Risk:Reward Ratio:1:3

    Note: The above is just a sample — a single trade does not prove or disprove an analysis. Trading success is measured by statistics.

  • Latest comments

    Loading next article…
    Risk Disclosure: Trading in financial instruments and/or cryptocurrencies involves high risks including the risk of losing some, or all, of your investment amount, and may not be suitable for all investors. Prices of cryptocurrencies are extremely volatile and may be affected by external factors such as financial, regulatory or political events. Trading on margin increases the financial risks.
    Before deciding to trade in financial instrument or cryptocurrencies you should be fully informed of the risks and costs associated with trading the financial markets, carefully consider your investment objectives, level of experience, and risk appetite, and seek professional advice where needed.
    Fusion Media would like to remind you that the data contained in this website is not necessarily real-time nor accurate. The data and prices on the website are not necessarily provided by any market or exchange, but may be provided by market makers, and so prices may not be accurate and may differ from the actual price at any given market, meaning prices are indicative and not appropriate for trading purposes. Fusion Media and any provider of the data contained in this website will not accept liability for any loss or damage as a result of your trading, or your reliance on the information contained within this website.
    It is prohibited to use, store, reproduce, display, modify, transmit or distribute the data contained in this website without the explicit prior written permission of Fusion Media and/or the data provider. All intellectual property rights are reserved by the providers and/or the exchange providing the data contained in this website.
    Fusion Media may be compensated by the advertisers that appear on the website, based on your interaction with the advertisements or advertisers.
    © 2007-2024 - Fusion Media Limited. All Rights Reserved.