- Investors are closely watching earnings and economic data releases to gauge the impact of the Federal Reserve's interest-rate hikes on the U.S. economy
- The Fed has been raising interest rates in an effort to reduce inflation, but this may also hinder economic growth and shrink bank profit margins
- Shares of U.S. banks have been performing poorly due to concerns about a potential recession and weakening profit margins
- U.S. Treasury yields have recently fallen to three-month lows, indicating that investors are becoming more risk-averse and seeking out safer investments, such as government bonds
- Gold prices rose slightly on Friday despite expectations for more interest-rate hikes from the Fed, which can be seen as negative for gold
Next week, investors will be closely watching earnings and economic data releases for insights into whether the Federal Reserve's interest rate-hiking campaign will lead to a recession in the U.S. Some of the critical releases include housing starts data on Tuesday; earnings reports from companies such as General Mills (NYSE:GIS), FedEx (NYSE:FDX), Nike (NYSE:NKE), Carnival (NYSE:CCL), Cintas (NASDAQ:CTAS), and Micron Technology (NASDAQ:MU). On Thursday, the release of the December jobless claims will also be closely watched for signs regarding the health of the U.S. economy. Market participants will also be paying attention to any comments from the Federal Reserve about its plans for future interest-rate hikes.
Shares of U.S. banks have been performing poorly in December due to concerns about an expected recession and weakening profit margins. The S&P 500 banks index has declined approximately 11% this month, with shares of Bank of America (NYSE:BAC) falling 16%, Wells Fargo (NYSE:WFC) declining 14%, and JPMorgan Chase (NYSE:JPM) down 6%. These declines have been driven by investor concerns that the Federal Reserve's efforts to reduce inflation through monetary policy tightening will also hinder economic growth. Additionally, higher interest rates may shrink bank profit margins if the interest paid on deposits eats into the interest earned from loans. Job cuts at Goldman Sachs (NYSE:GS) suggest banks are preparing for a challenging economic environment. While bank stocks have generally tracked the S&P 500 throughout the year, the S&P 500 banks index is now down 24% in 2022. The S&P 500 is on pace for its largest annual percentage drop since 2008.

Source: Investing.com
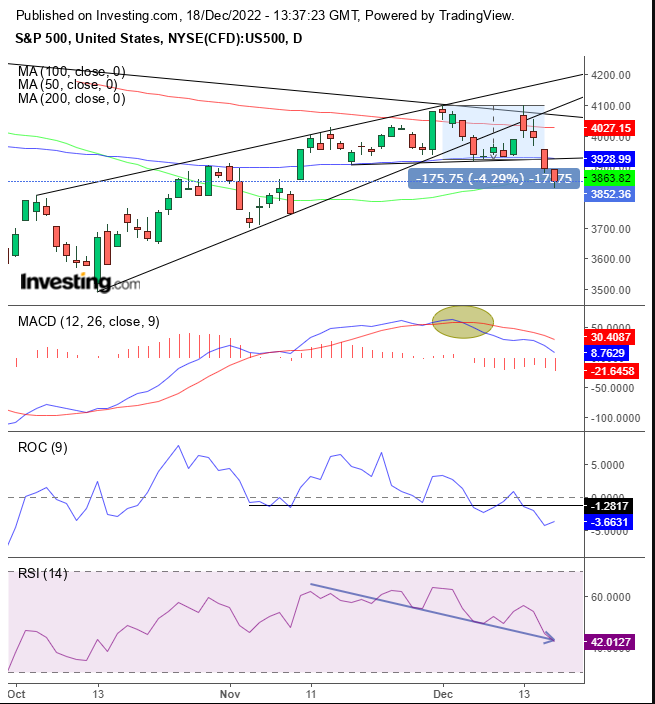
The S&P 500 completed a small head-and-shoulders top, implying a 3,750 target, heading to my 3,000 targets. The price found resistance near the moving averages last week and proceeded to fall through them all. The 200-day moving average (DMA) realigned with the medium-term falling channel, and the 100 DMA joined the H&S neckline. The moving average convergence/divergence (MACD), rate of change (ROC), and relative-strength index (RSI) indicators were all bearish.

Source: Investing.com
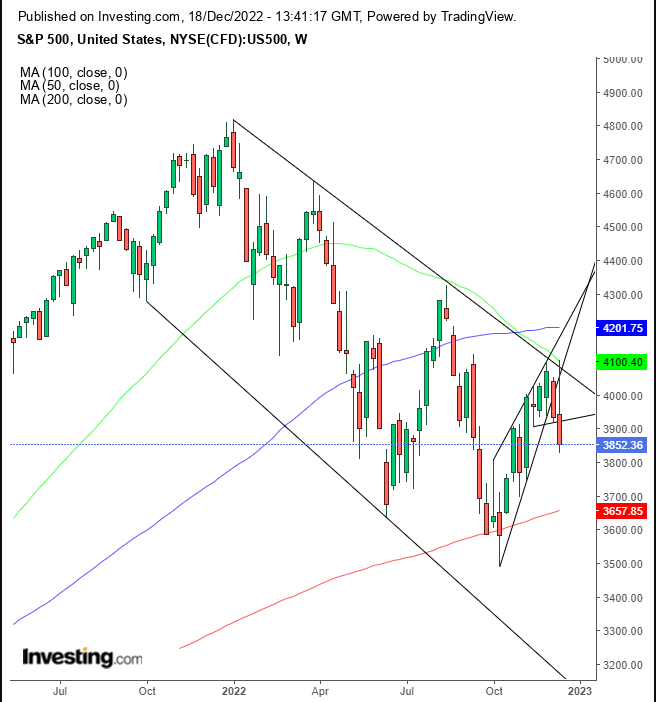
The S&P 500 Index fell for a second consecutive week, strengthening the argument for a rising wedge and ending the short-term uptrend, which resynced with the medium-term downtrend.
U.S. Treasury yields are the interest rates the U.S. government pays on its debt. When investors are concerned about economic growth and the potential for a recession, they may seek out the relative safety of government bonds. As demand for bonds increases, those bonds' prices rise, resulting in lower yields. So, when yields fall to three-month lows, it could be an indication that investors are becoming more risk-averse and seeking out safer investments, such as government bonds. This is often seen as a sign that investors are concerned about the economy's health and potential growth prospects.

Source: Investing.com
10-year Treasury yields have fallen for six of the past eight weeks, possibly forming an H&S top.
The U.S. dollar was little changed for the week, but observant technicians may have noticed that it found support near the previous Aug. 8 low.

Source: Investing.com
The weekly dollar chart formed an imperfect (due to a small upper shadow) hammer following another potentially bullish weekly imperfect inverted hammer (due to a small lower shadow). Is the greenback setting up an H&S top?
Gold prices rose slightly on Friday despite expectations for more interest-rate hikes from the Federal Reserve, which can be seen as negative for gold. Gold is often seen as a safe-haven asset, and it performs poorly when interest rates rise because it does not offer a yield. Higher interest rates can also lead to a stronger U.S. dollar, which can weigh on gold prices. However, on Friday, gold saw a corrective bounce after a strong sell-off following the Fed's interest-rate hike and comments from Fed Chair Jerome Powell indicating that more rate hikes are expected next year. Some analysts expect gold prices to continue to fall back toward $1,750 per ounce until it is clear that the Fed's cycle of rate hikes is over, but others see prices rising to $1,850 by the end of 2023.
Here is my analysis from last Monday

Source: Investing.com
Gold may be developing an H&S bottom.
Disclosure: At the time of publication, the author had no positions in the securities mentioned.
***
Looking to get up to speed on your next idea? With InvestingPro+ you can find
- Any company’s financials for the last 10 years
- Financial health scores for profitability, growth, and more
- A fair value calculated from dozens of financial models
- Quick comparison to the company’s peers
- Fundamental and performance charts
And a lot more. Get all the key data fast so you can make an informed decision, with InvestingPro+. Learn More »
